 E-submission
Articles
- Page Path
- HOME > J Mov Disord > Volume 16(3); 2023 > Article
-
Original Article
Spatiotemporal Gait Parameters in Adults With Premanifest and Manifest Huntington’s Disease: A Systematic Review -
Sasha Browning

 , Stephanie Holland, Ian Wellwood, Belinda Bilney
 -
Journal of Movement Disorders 2023;16(3):307-320.
DOI: https://doi.org/10.14802/jmd.23111
Published online: August 10, 2023
Faculty of Health Sciences, Australian Catholic University, Ballarat, Australia
- Corresponding author: Sasha Browning, BPhysio (Hons) Faculty of Health Sciences, Australian Catholic University, 1200 Mair Street, Lake Wendouree VIC, Ballarat 3350, Australia / Tel: +61-1300-275-228 / E-mail: Sasha.Browning@monashhealth.org
Copyright © 2023 The Korean Movement Disorder Society
This is an Open Access article distributed under the terms of the Creative Commons Attribution Non-Commercial License (http://creativecommons.org/licenses/by-nc/4.0/) which permits unrestricted non-commercial use, distribution, and reproduction in any medium, provided the original work is properly cited.
- 1,332 Views
- 91 Download
ABSTRACT
-
Objective
- To systematically review and critically evaluate literature on spatiotemporal gait deviations in individuals with premanifest and manifest Huntington’s Disease (HD) in comparison with healthy cohorts.
-
Methods
- We conducted a systematic review, guided by the Joanna Briggs Institute’s Manual for Evidence Synthesis and pre-registered with the International Prospective Register of Systematic Reviews. Eight electronic databases were searched. Studies comparing spatiotemporal footstep parameters in adults with premanifest and manifest HD to healthy controls were screened, included and critically appraised by independent reviewers. Data on spatiotemporal gait changes and variability were extracted and synthesised. Meta-analysis was performed on gait speed, cadence, stride length and stride length variability measures.
-
Results
- We screened 2,721 studies, identified 1,245 studies and included 25 studies (total 1,088 participants). Sample sizes ranged from 14 to 96. Overall, the quality of the studies was assessed as good, but reporting of confounding factors was often unclear. Meta-analysis found spatiotemporal gait deviations in participants with HD compared to healthy controls, commencing in the premanifest stage. Individuals with premanifest HD walk significantly slower (-0.17 m/s; 95% confidence interval [CI] [-0.22, -0.13]), with reduced cadence (-6.63 steps/min; 95% CI [-10.62, -2.65]) and stride length (-0.09 m; 95% CI [-0.13, -0.05]). Stride length variability was also increased in premanifest cohorts by 2.18% (95% CI [0.69, 3.68]), with these changes exacerbated in participants with manifest disease.
-
Conclusion
- Findings suggest individuals with premanifest and manifest HD display significant spatiotemporal footstep deviations. Clinicians could monitor individuals in the premanifest stage of disease for gait changes to identify the onset of Huntington’s symptoms.
- Involuntary choreatic movements, bradykinesia and changes in footstep patterns associated with damage to the basal ganglia nuclei are common in people with Huntington’s disease (HD) [1,2]. Postural instability [3] and cognitive changes [4] may also contribute to altered gait patterns in individuals with HD. With an average age of disease onset of 40 years [5],HD has a long premanifest period in which people who carry the HD genetic mutation are not yet displaying signs that prompt a clinical diagnosis [6]. A reliable means of assessment is needed to aid health professionals in the identification of motor decline in people with premanifest HD [1]. Spatiotemporal gait analysis has demonstrated high reliability in recognizing symptom onset in carriers of the HD mutation and is more sensitive than the United Huntington’s Disease Rating Scale (UHDRS) and the Total Motor Score (TMS), which are both commonly used to detect motor impairments [7,8]. Individuals with manifest HD also experience significant gait deviations, suggesting that footstep parameter changes may also be reliable biomarkers of HD progression [9]. Evidence to date suggests that variability in footstep characteristics provides the most accurate information on disease progression in comparison to other spatiotemporal parameters [9-13] and may allow clinicians to observe changes in their patients and assess the effectiveness of therapeutic interventions. As a practical and relatively inexpensive means of assessment, spatiotemporal gait analysis is suggested to be a reliable indicator of disease onset and progression in adults with premanifest and manifest HD [14].
- Although spatiotemporal footstep changes in people with premanifest and manifest HD have been documented, generalizing findings is difficult due to limitations in the literature. Small sample sizes and variation in research methodologies make the interpretation of results challenging for clinicians. A synthesis of the literature on spatiotemporal gait changes in people with neurological diseases has been suggested to address disparities in the evidence [15]. This study aimed to describe the spatiotemporal gait deviations in adults with premanifest and manifest HD compared to healthy controls. It was hypothesized that individuals with premanifest HD would exhibit changes and increased variability in spatiotemporal gait parameters compared to healthy controls, with increasing severity in individuals with manifest disease. The synthesis of available information will yield an improved understanding of changes in footstep characteristics that occur throughout disease progression. This may assist clinicians in using spatiotemporal gait analysis as a digital biomarker of motor decline in individuals with premanifest and manifest HD.
INTRODUCTION
- This systematic review, guided by the Joanna Briggs Institute’s (JBI) Manual for Evidence Synthesis [16], was registered with the International Prospective Register of Systematic Reviews (CRD42022318830) and reported in accordance with the Preferred Reporting Items for Systematic Reviews and Meta-Analyses (PRISMA) 2020 checklist.
- Search strategy
- The Cumulative Index to Nursing and Allied Health Literature (CINAHL), Medline, PubMed, Cochrane Library, Web of Science, Embase, Scopus and PEDro databases were systematically searched for original articles published prior to March 17th, 2022, using the following key terms:
- (Huntington*) AND (spatiotemporal OR spatial OR temporal OR time OR timing OR length OR velocity OR speed OR cadence OR variability) AND (gait OR footfall OR footstep OR walk* OR locomot* OR ambulat* OR mobility OR step OR stride OR stance OR swing).
- Subject headings for “Huntington’s Disease”, “spatiotemporal” and “gait”, unique to each database, were utilized in CINAHL, Medline and Embase. The full search strategy is available in the Supplementary Table 1 and Supplementary Figure 1 in the online-only Data Supplement.
- Eligibility criteria
- We included literature on spatiotemporal gait parameter changes in adults (≥ 18 years old) with premanifest HD (Pre-HD) or manifest HD, measured with instrumented gait analysis systems at self-selected walking speeds. Participants with Pre-HD who carried the HD genetic mutation but were not yet displaying symptoms severe enough to be clinically diagnosed with the disease were included [14]. Included studies contained a control group of healthy participants to allow comparisons against normative footstep data.
- Non-English studies, gray literature, nonhuman studies and studies reporting only kinematic or kinetic gait data were excluded from this systematic review. To ensure adequate quality and data accessibility of the included studies, we excluded non-peerreviewed studies, single-case reports, narrative reviews, abstractonly papers, conference proceedings and letters to the Editor. Studies with spatiotemporal gait data collected under dual-task, initiated or cued conditions were excluded, as these conditions may have resulted in deviations from the participants’ normal footstep patterns. Treadmill studies were also excluded, as the fixed speed may have altered the participants’ normal walking patterns and contribute to the heterogeneity of data when combined with findings from overground walking studies [17].
- Study selection
- Studies identified through the database searches were compiled, deduplicated and screened using the online software Covidence (https://www.covidence.org/) [18]. The selection criteria were independently applied to titles and abstracts by two reviewers (SB, SH). If a study met the criteria or its eligibility could not be determined based on title and abstract screening, the full text was obtained and screened independently by the two reviewers. Conflict was resolved through discussion or input from a third reviewer (BB or IW). Articles identified through forward and backward searches of the included studies and related systematic reviews also underwent this screening process.
- Data extraction
- Methodological and footstep data from the included studies were extracted by one reviewer (SB) and checked by a second reviewer (BB, IW). The parameters of interest included speed-related measures (gait speed and cadence), spatial measures (step length, step width and stride length) and temporal measures (stride time and double limb support [DLS] and single limb support [SLS] percentage and/or time). Variability within step length, stride length and stride time measures was also determined. Footstep data at the participant’s preferred walking speed were extracted from adults with PreHD and HD, as well as healthy controls. If necessary, units were converted to meters per second for gait speed, meters for spatial parameters and seconds for temporal data. Base of support data were combined with step width parameters; stride intervals were interpreted as stride times; and support time parameters were included under DLS data. Authors were contacted to request specific values if data were presented only in graphical format. If this failed, data were estimated from graphs.
- Study quality assessment
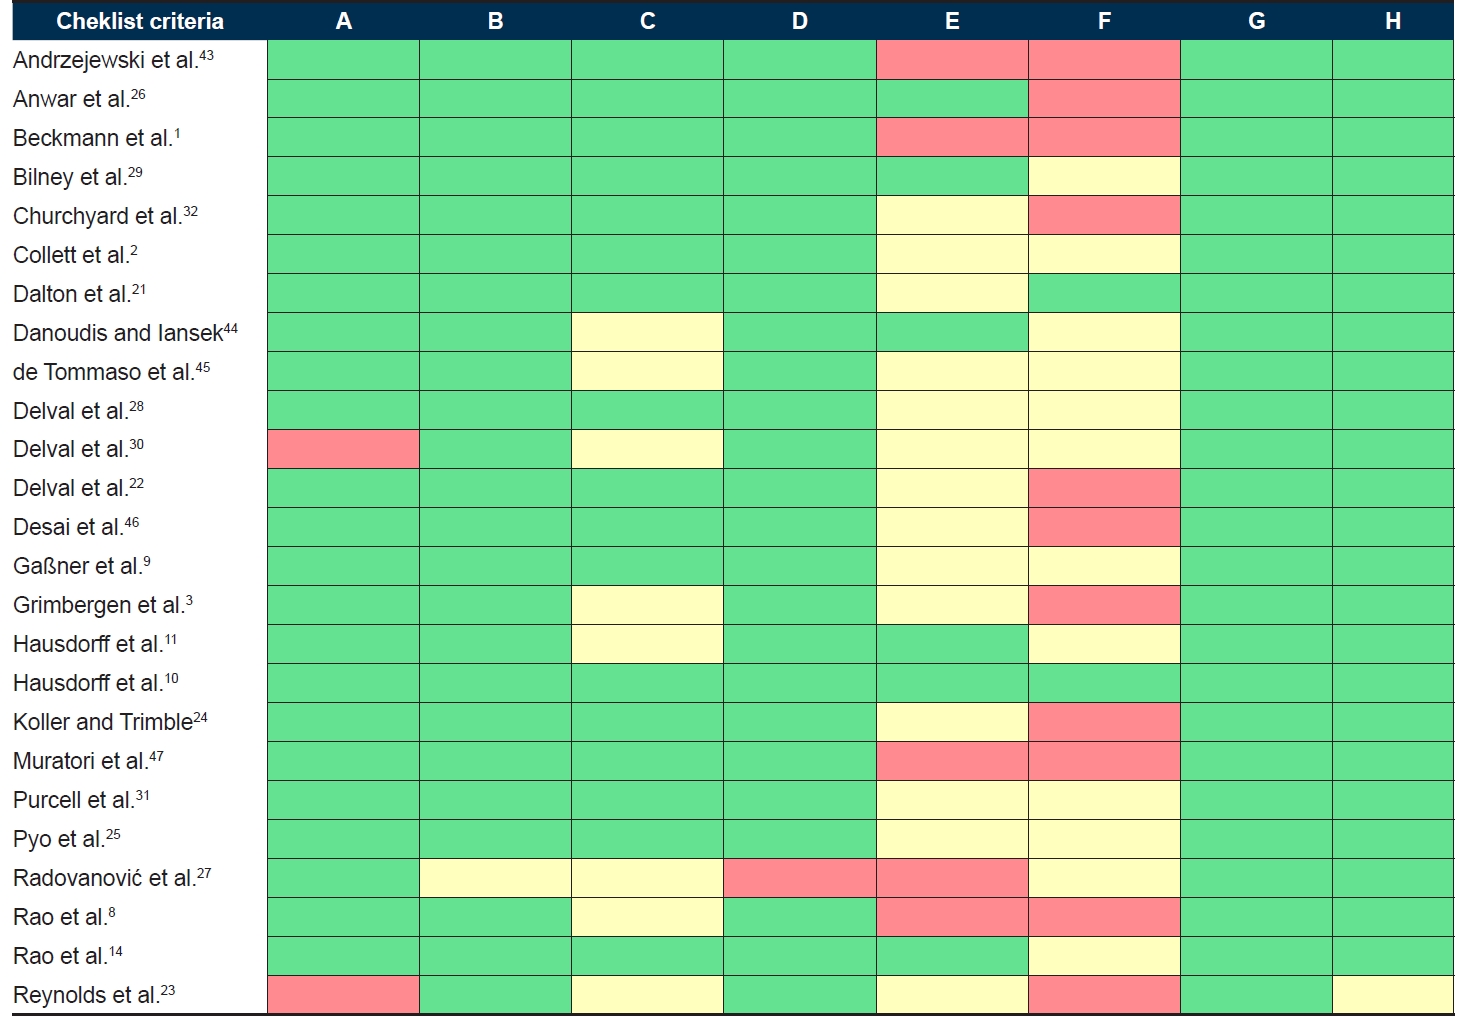
- The included studies were critically appraised using the JBI’s Checklist for Analytical Cross-Sectional Studies [16] by two reviewers (SB, IW). The checklist includes eight criteria (A-H in Figure 1) against which studies are evaluated.
- Quantitative data synthesis
- Meta-analyses were performed to estimate a pooled effect size for gait speed, cadence, stride length and stride length variability measures among PreHD, HD and healthy control cohorts. These parameters were chosen for meta-analysis as they were deemed to be clinically useful footstep measures. Review Manager 5.4.1 software (The Cochrane Institute, London, England) was used to calculate overall mean differences and 95% confidence intervals (CIs) and generate forest plots using a random-effects model. Heterogeneity (I2) was categorized as low (< 25%), moderate (25%–75%) or high (> 75%) [19]. Publication bias for each comparison was visually assessed using funnel plots [20].
MATERIALS & METHODS
- Study selection
- We screened 2,721 studies, identified 1,245 studies and included 25 studies (1,088 total participants). No additional studies were included following forward and backward searches of the included studies and relevant systematic reviews. The study selection is outlined in Figure 2.
- Characteristics of selected studies
- Table 1 outlines the methodological characteristics of each study. The included studies were published between 1985 and 2021, with 24 cross-sectional studies and one case‒control study. Sample sizes ranged from 14 to 96 participants. Twelve studies utilized wearable sensors or insoles to collect footstep data, and eight utilized the GAITRite® walkway (CIR Systems, Franklin, NJ, USA). Table 2 summarizes the baseline characteristics of the participants in the included studies. Footstep data were extracted for 75 participants with PreHD, 536 participants with HD and 477 healthy participants. From available data, the mean age of the participants with PreHD was 41.9 years, that of the participants with HD was 51.8 years and that of the controls was 49.4 years. Fourteen articles reported a female ratio between 40% and 60% in each participant group. Eleven studies reported on height or leg length, with five studies reporting both. When collected, the average mean TMS on the UHDRS was 2.86 for participants with PreHD and 37.60 for those with HD. Additionally, the average mean available total functional capacity (TFC) scores were 12.99 and 8.35 for participants with PreHD and HD, respectively.
- Study quality assessment
- Figure 1 outlines the results of the methodological quality and risk of bias assessment. Overall, the quality of the studies was assessed as good, but the reporting of the risk of confounding was often unclear. Few studies controlled for confounding factors, including differences in medication and body measurements (e.g., height, weight and leg length) among participants. Furthermore, 18 studies used unclear or convenience sampling for controls. Other possible sources of bias were identified, such as small sample sizes, unclear methods for determining an HD diagnosis and limited matching of controls to HD participants. Inspection of the funnel plots did not suggest publication bias across the studies included in the meta-analysis.
- Spatiotemporal gait changes in people with premanifest HD
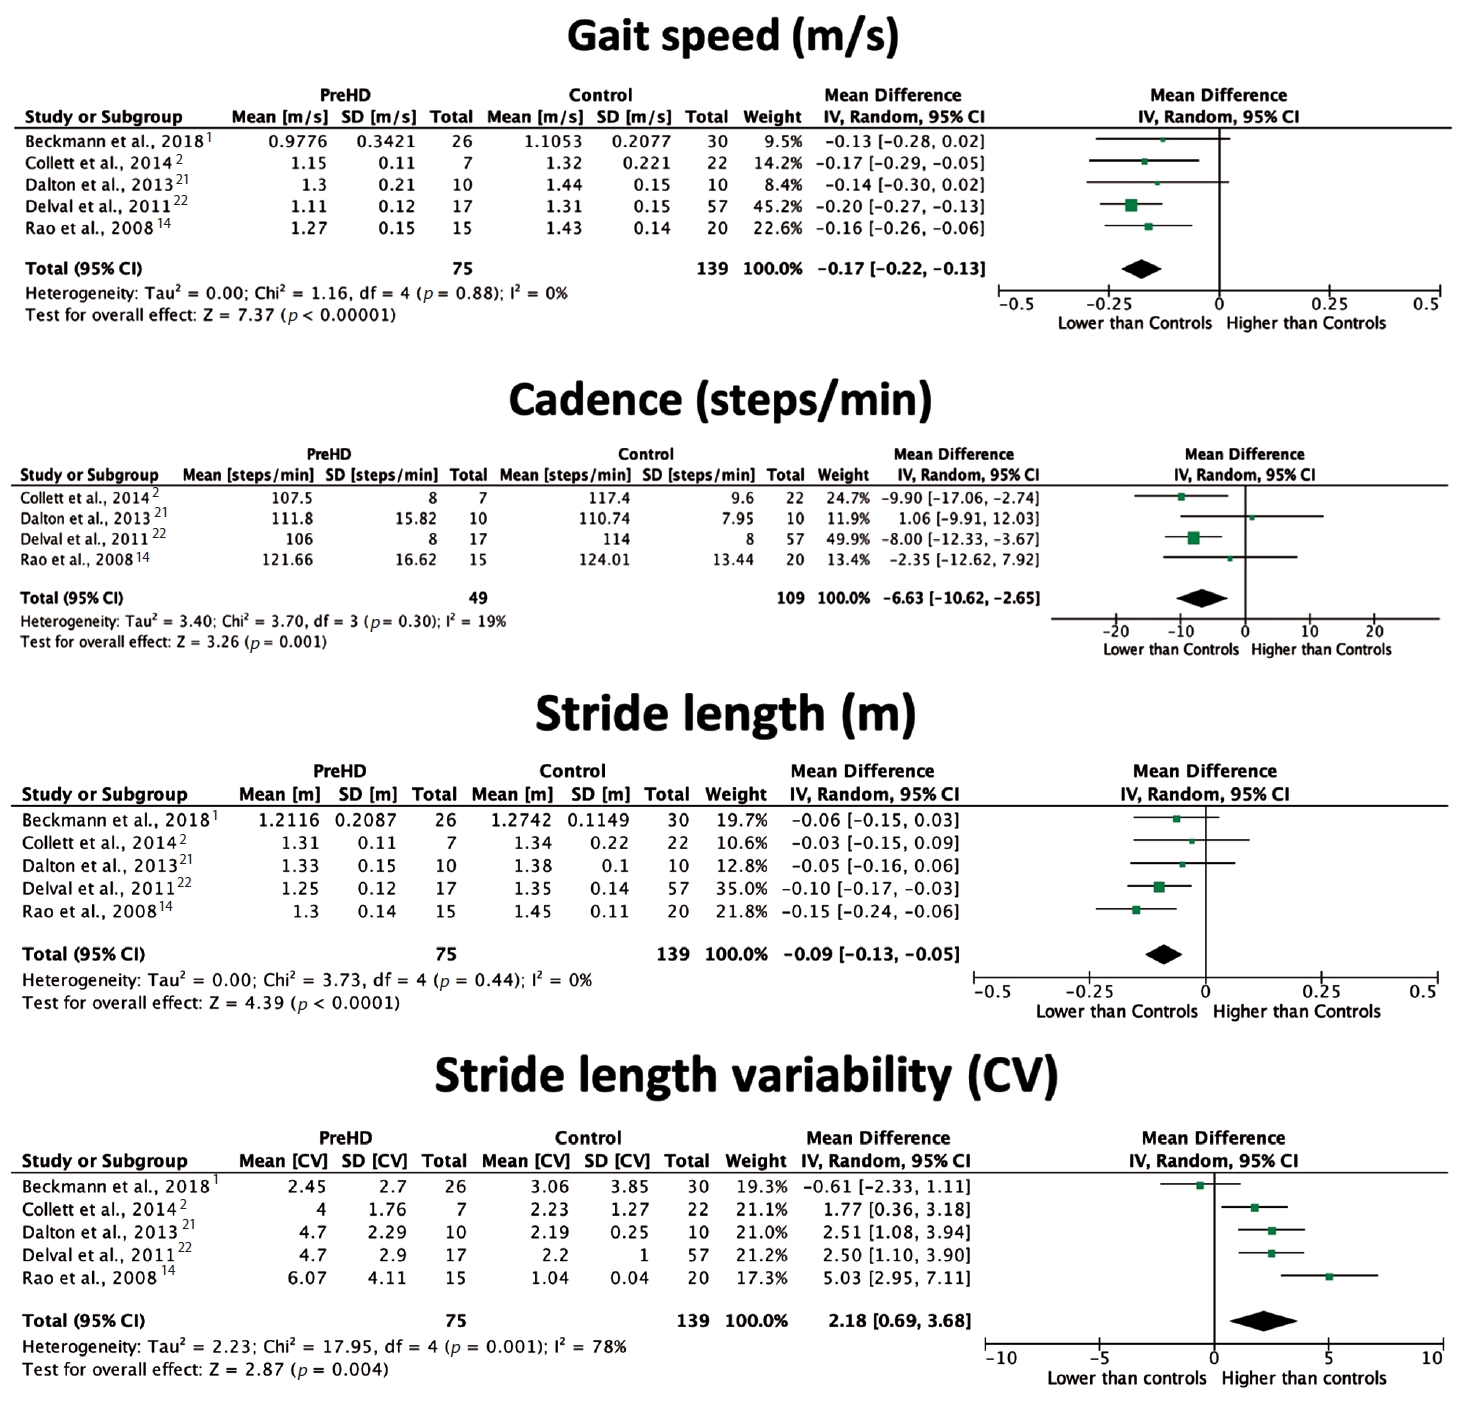
- Five included studies [1,2,14,21,22] (20%) reported on footstep parameter changes in participants with PreHD compared to healthy participants. Participants with premanifest HD were defined as presymptomatic [14,22] or premanifest1 mutation carriers [2] or gene carriers not yet demonstrating symptoms or functional decline [21]. All five studies reported gait speed and stride length changes, and the majority discussed cadence measures. Only two studies [14,22] found a significant difference in gait speed between participants with PreHD and healthy controls, with just one [22] presenting a significant finding for cadence. However, pooled analysis, outlined in Figure 3, showed a significant reduction in gait speed in individuals with PreHD compared to controls, with an overall mean difference of -0.17 m/s (95% CI [-0.22, -0.13], p < 0.00001). Cadence was reduced by 6.63 steps/min (95% CI [-10.62, -2.65], p = 0.001) in participants with PreHD. Stride length was reduced in participants with PreHD in two studies [14,22], with an overall difference of -0.09 m (95% CI [-0.13, -0.05], p < 0.0001) compared to controls. Conversely, there was a positive effect of PreHD on stride length variability, with a mean difference of 2.18% (95% CI [0.69, 3.68], p = 0.004). Low heterogeneity was found across studies in gait speed, cadence and stride length analyses; however, stride length variability was highly heterogeneous (I2 = 78%), and this finding should be interpreted with caution. The DLS percentage was also found to be significantly higher in participants with PreHD than in controls [1,22], with individual papers reporting significant reductions in step length [21] and step width [14]. A significant increase in step length and stride time variability was also noted in people with PreHD [21,22]. When compared to participants with manifest HD, in individuals with PreHD, gait speed and stride length were found to be higher, while stride length variability was lower [1,14,21]. Therefore, spatiotemporal deviations appear to worsen with disease progression.
- Spatiotemporal gait changes in people with manifest HD
- Speed-related measures, spatial parameters, temporal parameters and gait variability measures in participants with HD are described below. Due to a lack of consistency regarding how stages of HD progression were classified, three papers [2,3,14] were not included in this meta-analysis, as the findings were presented solely in relation to subgroups of manifest HD. Limited data reporting prevented one study [23] from being included in the synthesis. One study [11] was excluded from the meta-analysis, as the author reported using participants from an already included study [10].
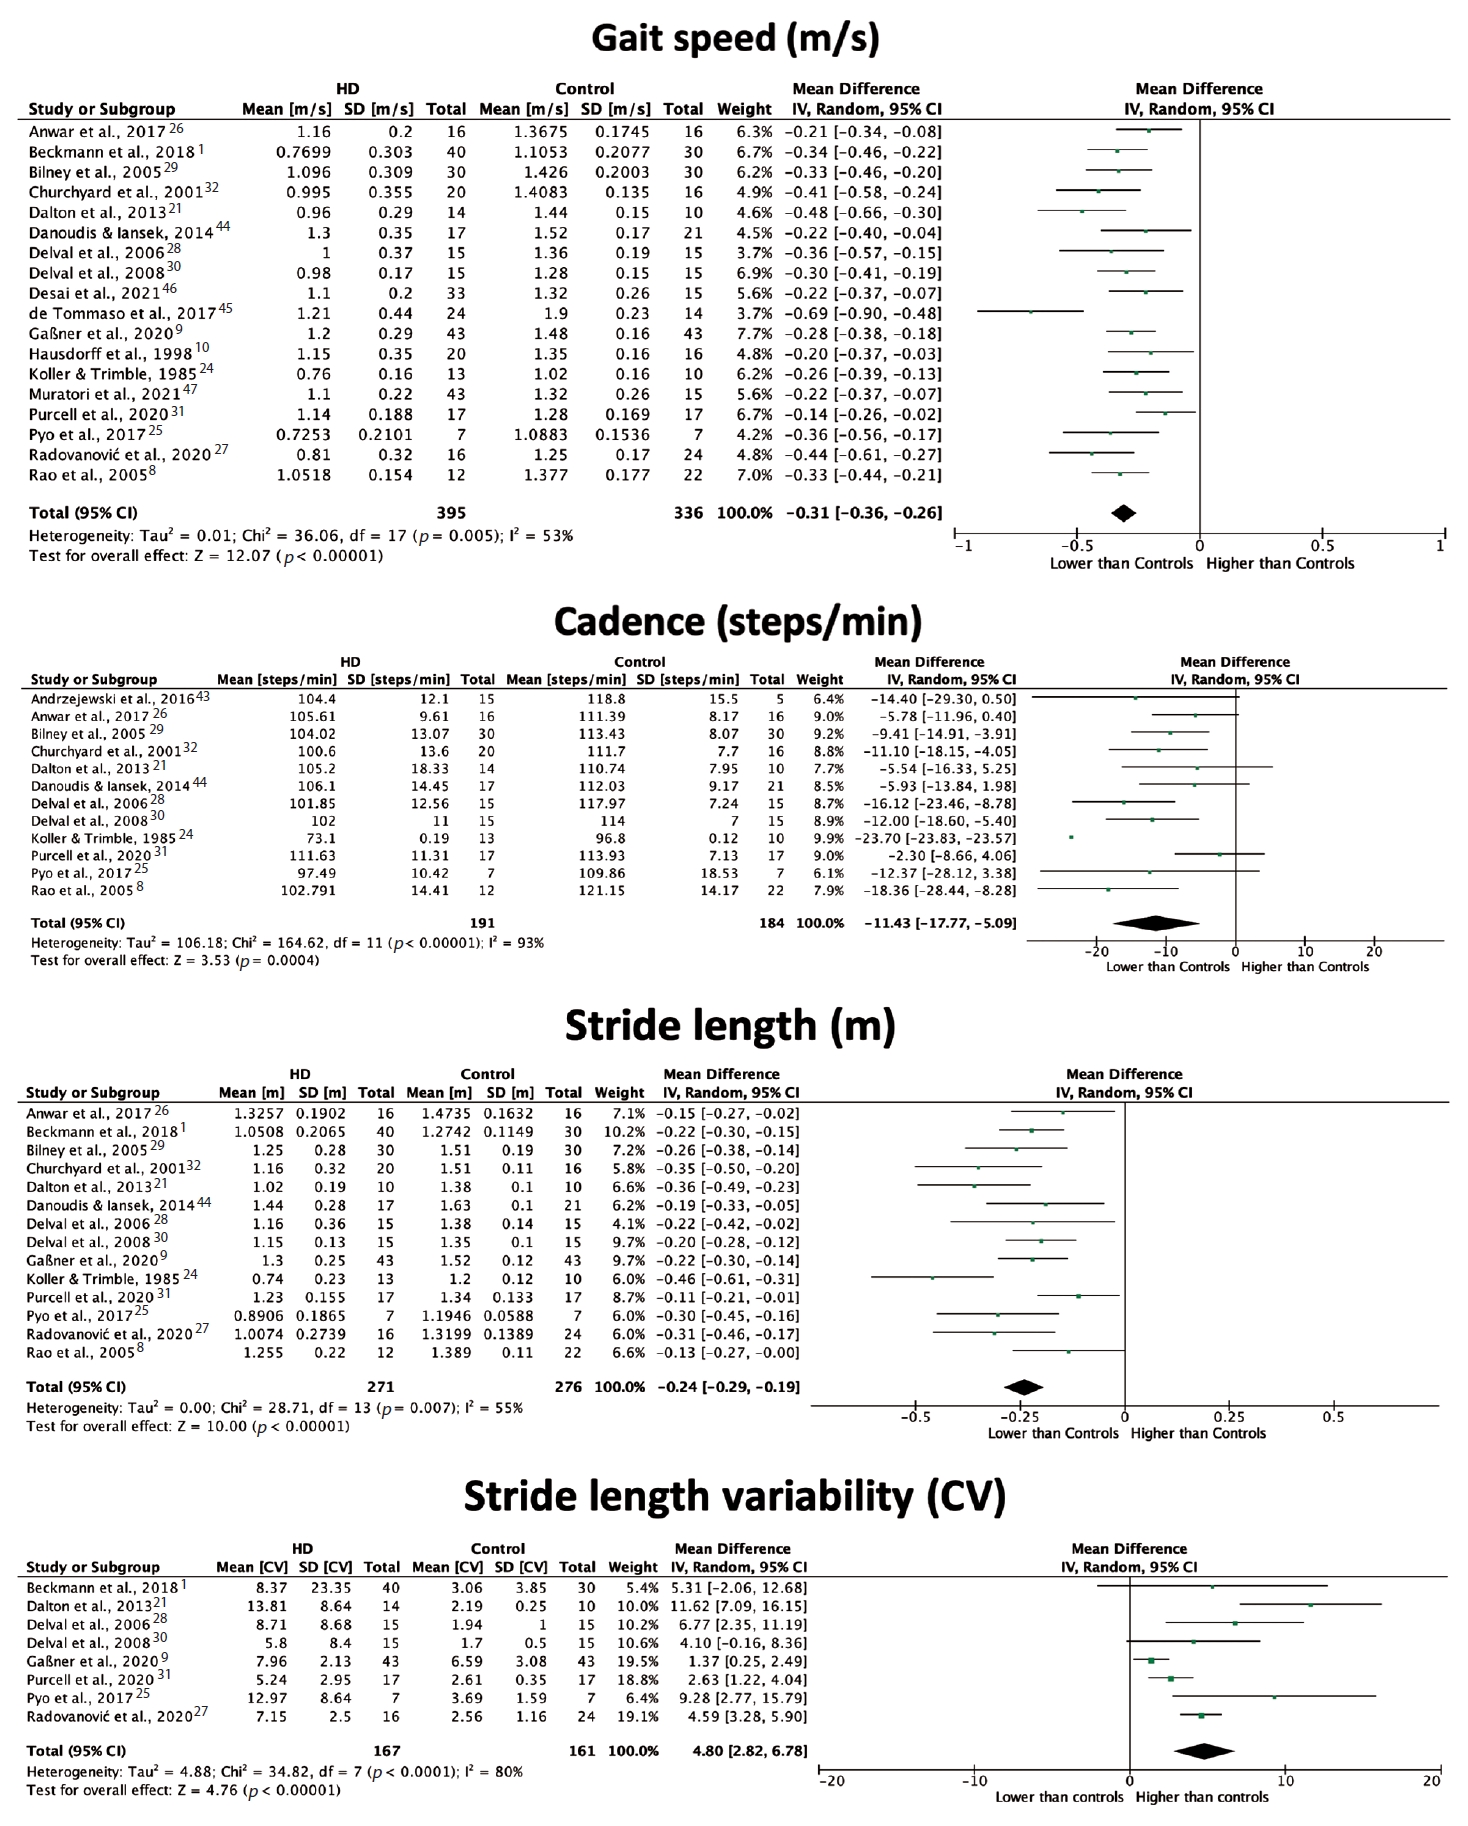
- All included studies reported on at least one speed-related spatiotemporal gait parameter. The majority of the included studies reported gait speed data, with all but one [10] finding a significant reduction in individuals with manifest HD compared to healthy controls. As outlined in Figure 4, the meta-analysis estimated significantly lower gait speed in individuals with HD compared to those without HD, with an overall mean difference of -0.31 m/s (95% CI [-0.36, -0.26], p < 0.00001). Sixteen studies examined differences in cadence between participants with HD and controls, with the majority finding a significant reduction in this parameter for participants with HD. Combining these findings produced an overall difference of -11.43 steps/min (95% CI [-17.77, -5.09], p = 0.0004). High heterogeneity across studies (I2 = 93%) should be considered when interpreting this result, although post hoc sensitivity analysis revealed one study24 to be a major source of heterogeneity (33%).
- Most included studies (76%) reported on at least one spatial gait parameter, including stride length, step length and step width. Most found stride length to be significantly reduced in participants with manifest HD compared to healthy controls. Pooled stride length measures (Figure 4) resulted in an overall mean difference between participants with HD and control participants of -0.24 m (95% CI [-0.29, -0.19], p < 0.00001), with moderate heterogeneity between studies. Likewise, step length was reported to be significantly shorter in individuals with HD than in controls [21,25,26]. Four studies [8,14,25,26] also found step width to be significantly wider in participants with HD compared to controls, indicating the presence of a wide base of support.
- Over half of the included studies described one or more temporal characteristics of the participant gait patterns. While eight studies examined differences in the DLS percentage of the gait cycle, only two [1,14] found it to be significantly higher in participants with HD than in controls. Similarly, only two studies [24,27] found the DLS time to be significantly increased in individuals with HD compared to healthy controls. Both the SLS time and percentage were found to be significantly reduced in the HD cohort [25,28]. Stride time was also determined to be significantly longer in duration in participants with HD than in controls [9,28].
- Fifteen studies (60%) examined variability within footstep parameters in participants with HD and healthy participants. Most studies [2,3,9,14,21,25,27-31] found stride length variability to be significantly greater in individuals with HD than in healthy controls. Combined analysis (Figure 4) found a positive effect of HD on stride length variability, with an overall mean difference of 4.80% (95% CI [2.82, 6.78], p < 0.00001). Heterogeneity across studies was high (I2 = 80%), and estimation of an overall effect may be inappropriate. Variability in stride time [9-11,28] and step length [21,25] was also demonstrated to be significantly greater in the HD groups than in the control groups.
- Correlations between gait changes and disease severity
- Seven [9,10,14,25,28,31,32] studies used correlation analyses to examine the relationship between gait parameter changes in participants with HD and disease severity based on the TMS and TFC score. All studies found moderate to strong correlations between footstep parameter changes and the TMS and TFC score. Both gait speed and stride length were negatively correlated with the TMS [9,28,32]. In contrast, stride length variability had a positive relationship with the TMS [9,31]. Interestingly, two studies [25,32] found no significant correlation between cadence and DLS measures with the TMS. One study [28] found gait speed to be positively correlated with the TFC score, while another [9] outlined negative relationships with stride length and stride time variability.
RESULTS
Speed-related measures
Spatial parameters
Temporal parameters
Gait variability measures
- To our knowledge, this is the first systematic review to quantitatively synthesize literature on the spatiotemporal gait changes that occur throughout the progression of HD. Through the comprehensive collation of footstep data from 1,088 participants across 25 articles, our findings confirmed the existence of spatiotemporal gait changes in the presence of the HD genetic mutation. This review established that individuals identified as being in the premanifest stage of the disease had significant alterations in footstep patterns compared to healthy controls. In particular, the premanifest period featured significant effects on speed, cadence and stride length measures, indicating the presence of spatiotemporal changes prior to other motor changes. Changes in footstep patterns were also intensified in individuals with a confirmed diagnosis of HD. Spatiotemporal variability was noted in individuals with PreHD and further increased in those with manifest disease compared to healthy controls, suggesting greater irregularity in step and stride parameters across gait cycles. Multiple studies also linked reductions in gait speed and stride length and increased spatiotemporal variability to a poorer TMS and TFC score in people with manifest HD.
- Alterations in footstep patterns in carriers of the HD mutation may reflect the disease’s underlying pathological process, inhibiting the neural pathways involved in gait regulation [33]. Impairment in basal ganglia functioning results in a hyperkinetic disorder and a lack of inhibitory motor control [33], leading to the typical choreatic movement described in HD [34]. However, our findings suggest the presence of hypokinesia, as observed in the reduced amplitude and speed gait parameters, commencing in the premanifest disease stage. Reduced postural control in individuals with PreHD and HD may also manifest as an increased DLS duration and step width, as well as reduced time spent in SLS, perhaps reflecting an attempt to establish stability throughout the gait cycle [35]. Furthermore, dementia may contribute to declining gait speed [36,37] as a common symptom of HD [38], often occurring in the early stages of disease. Reduced gait speed may also be the result of an inadequate step or stride length in people with PreHD and HD.
- The findings of this review suggest that spatiotemporal footstep changes could potentially act as digital biomarkers, allowing health professionals to effectively monitor the onset of motor decline in people who carry the HD genetic mutation. As an efficient means of assessment, spatiotemporal gait analysis may have benefits over other tools currently in clinical use for individuals with PreHD. Early detection of decline in motor functioning and delivery of timely interventions, such as pharmacological and exercise therapies, may help to maximize patient outcomes [39]. Our findings also indicate the worsening of spatiotemporal gait deviations in individuals with manifest disease, with significant relationships between footstep changes and clinical outcome measures that detect functional and motor decline. These findings suggest that spatiotemporal gait analysis (particularly spatial measures) may be an effective tool to monitor the progression of disease in individuals with manifest HD.
- This systematic review collated existing research; however, a number of issues should be considered. We acknowledge that the exclusion of non-English and gray literature increases the risk of selection bias and that considerable heterogeneity among the included studies is a key limitation. Disparities in participant characteristics, including disease stage, height, leg length, weight and medication use, are likely to be major sources of variation across the included studies. Anthropometric data were only recorded in half of the included studies, which rarely controlled for potentially impacting gait parameters [40,41]. Participant weight was notably underreported in the literature, suggesting that the influence of body weight on footstep parameters is not fully understood. Most studies grouped participants with manifest HD together, despite probable differences in symptom severity, likely contributing to heterogeneous results in the footstep data. Variations in methodology across studies may have also contributed to diversity in the findings. In particular, studies utilizing longer distances to collect footstep data may have recorded higher measures of spatiotemporal variability compared to measurements collected for shorter distances.
- The underrepresentation of individuals with PreHD and disparities in HD subgroup classifications mean that comparisons of footstep measures at differing stages of manifest disease remain difficult. However, despite utilizing differing classification systems for disease severity, two included studies [2,14] found preliminary evidence that spatiotemporal gait changes worsen with each stage of the disease. HHT CAG repeat length can also be used to classify disease severity [42-47]. With less than half of the included studies reporting these data, the association of CAG repeat length with gait parameter changes remains unclear. If individual patient data from the original studies are available, it may be possible to perform further data synthesis and meta-analyses on gait parameters with predefined subgroups that would allow the exploration of the relationship among gait parameters, CAG repeat length and predominant movement disorder. This might allow for greater consistency in how the stages of HD progression are defined. It is also suggested that studies strive for more representative sampling and recruitment procedures to increase external validity and include participants with PreHD. Finally, further exploration into the relationship between step length and speed-related measures may help in the design of therapeutic interventions to improve walking patterns in individuals with Pre-HD and HD.
- Overall, the quantitative synthesis of the included studies demonstrated significant spatiotemporal footstep deviations in people with HD compared to healthy controls. This systematic review outlined the key spatiotemporal gait changes that present in the premanifest stage of the disease, including reduced gait speed, cadence and stride length and increased spatiotemporal variability in individuals with HD. The included studies demonstrate the challenges of working with a relatively rare population and controlling for potential confounders, and some results should be interpreted accordingly. Monitoring gait characteristics in people with premanifest HD could help in identifying the onset of symptoms earlier than other currently used biomarkers. This might allow for timely referral for health care interventions that may alter the trajectory of disease progression and improve the quality of life of individuals who carry the HD mutation.
DISCUSSION
Supplementary Materials
Supplementary Figure 1.
-
Conflicts of Interest
The authors have no financial conflicts of interest.
-
Funding Statement
None
-
Author contributions
Conceptualization: Sasha Browning, Ian Wellwood, Belinda Bilney. Data Curation: Sasha Browning. Formal analysis: all authors. Investigation: Sasha Browning. Methodology: all authors. Project administration: Sasha Browning. Supervision: Ian Wellwood, Belinda Bilney. Validation: Sasha Browning, Ian Wellwood, Belinda Bilney. Visualisation: Sasha Browning, Ian Wellwood, Belinda Bilney. Writing—original draft: Sasha Browning. Writing—review & editing: Sasha Browning, Ian Wellwood, Belinda Bilney.
Notes
Quality analysis of the included studies using the Joanna Briggs Institute’s checklist for analytical cross-sectional studies and supplementary assessments
The study selection process outlined through a PRISMA flowchart. PRISMA, Preferred Reporting Items for Systematic Reviews and Meta-Analyses.

| Authors (country) | Year | Sample | Instrumented gait system | Walking protocol | Spatiotemporal gait parameters collected |
|---|---|---|---|---|---|
| Andrzejewski et al. [43] (UK) | 2016 | 20 | Accelerometer-based, wearable PAMSys-X chest sensors (BioSensics, Newton, MA, USA) | Using sensor data from 7 days, equally weighted walking windows of 10 steps or more were identified from which gait measures were computed | Step time, cadence |
| Anwar et al. [26] (Australia) | 2017 | 32 | GAITRite® System (CIR Systems, Franklin, NJ, USA) | 6 unobstructed, free walking trials at their preferred speed | Velocity, cadence, step length, step time, step width, stride length, stride time, stride width, stride velocity, swing time, stance time |
| Beckmann et al. [1] (Germany) | 2018 | 96 | GAITRite® System (CIR Systems, Franklin, NJ, USA) | 4 trials of 10–20 seconds, at normal and fast speeds | Velocity, stride length, double support, stride length coefficient of variation (CV) |
| Bilney et al. [29] (Australia) | 2005 | 60 | Clinical Stride | 5 trials over a 16 m walkway (data collected over 10 m), at self-selected, fast, slow and metronome speeds | Gait speed, cadence, stride length, double support duration |
| Analyser | |||||
| Churchyard et al. [32] (Australia) | 2001 | 36 | Clinical Stride | 5 trials of 10 m walking at preferred speed, slow, fast and dual-task conditions | Velocity, stride length, cadence, double stance duration |
| Analyser | |||||
| Collett et al. [2] (UK) | 2014 | 57 | Inertial measurement units attached to the lower back | 10 m walking at self-selected speed | Step time, step time CV, cadence, cadence CV, stride length, stride length CV, speed |
| Dalton et al. [21] (UK) | 2013 | 34 | Triaxial accelerometer attached to sternum | 5 trials on a 4.8 m walkway (walked 2 m before and after) at a comfortable pace | Velocity, cadence, step length, step time, stride length, step time CV, step length CV, stride length CV |
| Danoudis and Iansek [44] (Australia) | 2014 | 58 | GAITRite® System (CIR Systems, Franklin, NJ, USA) | 3 trials of 8 m or 5 trials of 4.6 m, at preferred, very slow, slow, fast and very fast speeds | Gait speed, stride length, cadence |
| de Tommaso et al. [45] (Italy) | 2017 | 38 | Pedometer | 10 × 5 m path, as naturally as possible for 5 m, during single-task and dual-task conditions | Gait speed |
| Delval et al. [28] (France) | 2006 | 45 | VICON video motion analysis system (VICON Systems, Oxford, | 14 gait cycles in underwear and bare feet, at normal walking speed | Stride length, stride time, gait speed, cadence, single/double support time and percentage, gait variability of each |
| Delval et al. [30] (France) | 2008 | 30 | VICON video motion analysis system (VICON Systems, Oxford, England) | 14 gait cycles in underwear and bare feet, at normal walking speed | Cadence, gait speed, stride length, single support/double support time, variability of cadence CV, gait speed CV and stride length CV |
| Delval et al. [22] (France) | 2011 | 74 | VICON video motion analysis system (VICON Systems, Oxford, England) | 14 gait cycles in underwear and bare feet, at normal walking speed | Stride length, velocity, cadence, double support percentage, stride duration, stride duration CV, stride length CV |
| Desai et al. [46] (International) | 2021 | 48 | Opal inertial measurement unit (IMU) sensors (APDM Wearable Technologies, Portland, OR, USA) | 7 m walkway (up and back), with no load and then with cognitive load | Gait speed |
| Gaßner et al. [9] (Germany) | 2020 | 86 | SHIMMER sensors laterally attached to posterior shoes | 4 trials of 10 m overground walk, at self-selected speed, without stops at turning points | Stride length, gait speed, stance time, swing time, stride time CV, stance time CV, swing time CV |
| Grimbergen et al. [3] (The Netherlands) | 2008 | 72 | GAITRite® System (CIR Systems, Franklin, NJ, USA) | 3 trials of walking straight ahead, at a comfortable speed | Gait speed, stride length, stride length CV |
| Hausdorff et al. [11] (United States) | 1997 | 27 | Force-sensitive insoles placed in the subject’s right shoe | 5 minutes down a 77 m hallway at self-determined rate without stopping, on level ground | Stride interval, stride interval CV, gait speed |
| Hausdorff et al. [10] (United States) | 1998 | 62 | Force-sensitive insoles placed in the subject’s right shoe | 5 minutes down a 77 m hallway at self-determined rate without stopping, on level ground | Stride time, swing time, double stance time, step time, gait speed, variability of each |
| Koller and Trimble [24] (United States) | 1985 | 23 | Ultrasonic stride analyser | 25 ft (7.62 m) pathway at a self-selected pace, 10 ‘walks’ per test, completed before and after haloperidol dose | Gait speed, stride length, cadence, total cycle time, swing time, support time |
| Muratori et al. [47] (International) | 2021 | 58 | Opal IMU sensors (APDM, Portland, OR, USA) | 7 m pathway at a comfortable pace, then with a cognitive task | Gait speed |
| Purcell et al. [31] (United States) | 2020 | 34 | Opal IMU sensors (APDM, Portland, OR, USA) | Two minutes of walking down a 25 m track at a self-selected pace, as fast as possible and with verbal fluency | Cadence, gait speed, step duration, stride length, double support, swing percentage, stride length CV |
| Pyo et al. [25] (South Korea) | 2017 | 14 | GAITRite® System (CIR Systems, Franklin, NJ, USA) | 10 cycles measured at usual speed | Step length, stride length, base of support, cadence, gait speed, single support time, double support time, single support percentage, double support percentage, swing time percentage, stance time percentage, variability of each |
| Radovanović et al. [27] (International) | 2020 | 40 | GAITRite® System (CIR Systems, Franklin, NJ, USA) | Minimum 6 trials on a 5.5 m walkway, at a comfortable walking speed, then an added motor and mental task | Gait speed, stride length, cycle time, swing time, double support time, variability of each |
| Rao et al. [8] (United States) | 2005 | 34 | GAITRite® System (CIR Systems, Franklin, NJ, USA) | 2 trials of 2 sets on a 10 m walkway, at a ‘normal, comfortable pace’ | Gait speed, cycle time, stride length, cadence, base of support |
| Rao et al. [14] (United States) | 2008 | 65 | GAITRite® System (CIR Systems, Franklin, NJ, USA) | 3 trials on a 4.6 m walkway, at preferred walking speed | Gait speed, stride length, stride length CV, cadence, double support percentage, support base, stance percentage, step time, step time CV |
| Reynolds et al. [23] (United States) | 1999 | 36 | Retroreflective markers on standard bony landmarks, five video angles, fed into digitizer | 3 gaits cycles for each side of the body on a 12 m walkway, at a freely chosen speed in low heeled shoes | Gait cycle duration, stance time, stance time percentage, gait speed, cadence, stride length |
| Authors | No. of participants | Age (yr) | Gender (% of female) | Height (m) | Leg length (m) | HTT CAG repeat number | TMS | TFC | Control matching |
|---|---|---|---|---|---|---|---|---|---|
| Andrzejewski et al. [43] | HD: 15 | 56.8 ± 6.6 | 40 | - | - | - | 42.3 ± 13.3 | - | Not stated |
| CO: 5 | 53.4 ± 20.4 | 60 | |||||||
| Anwar et al. [26] | HD: 16 | 53.31 ± 7.1 | 25 | 1.7 ± 0.08 | 1.02 ± 0.05 | 43.44 ± 1.79 | - | - | Age, height, weight, leg length |
| CO: 16 | 53.5 ± 6.54 | 25 | 1.7 ± 0.07 | 1.01 ± 0.04 | |||||
| Beckmann et al. [1] | Pre: 26 | 37.9 ± 11.1 | 53.85 | - | - | 41.6 ± 2.3 | 1 ± 1.4 | 12.96 ± 0.2 | Age |
| HD: 40 | 47.7 ± 9.9 | 60 | 44.1 ± 2.9 | 33.6 ± 16.7 | 8.9 ± 3.5 | ||||
| CO: 30 | 38.6‡ | 63.33 | |||||||
| Bilney et al. [29] | HD: 30 | 51.2 ± 10.6 | 30 | 1.73 ± 0.11 | - | 43.3 ± 2.57 | 40.92 ± 26.32 | - | Age, gender, height |
| CO: 30 | 50.9 ± 11.6 | 30 | 1.74 ± 0.9 | ||||||
| Churchyard et al. [32] | HD: 20 | 58.2 ± 12.9 | 20 | - | - | - | 44.1 ± 25.5 | - | Age, height |
| CO: 16 | 55.4 ± 10.5 | 18.75 | |||||||
| Collett et al. [2] | Pre: 7 | 48 ± 16 | 71.4 | 1.69 ± 0.11 | 0.93 ± 0.07 | 41 ± 3 | 1 (0–4) | 13 (13–13) | Age, gender, BMI, height, leg length |
| HD I: 16 | 47 ± 10 | 50 | 1.69 ± 0.10 | 0.92 ± 0.06 | 45 ± 3 | 28.5 (11–73) | 9 (7–13) | ||
| HD II: 12 | 50 ± 14 | 25 | 1.69 ± 0.07 | 0.9 ± 0.03 | 47 ± 7 | 59.5 (17–78)* | 5 (4–6)* | ||
| CO: 22 | 46 ± 10 | 50 | 1.7 ± 0.1 | 0.91 ± 0.06 | |||||
| Dalton et al. [21] | Pre: 7 | 44.8 ± 11.7 | 60 | 1.71 ± 0.1 | 0.92 ± 0.06 | - | 4.8 ± 5.3 | 13 | Age, gender, weight, height, leg length |
| HD: 14 | 51.83 ± 14.8 | 43 | 1.68 ± 0.09 | 0.9 ± 0.04 | 54.15 ± 13.02 | 6.33 ± 2.18 | |||
| CO: 22 | 56.4 ± 10.9 | 50 | 1.71 ± 0.07 | 0.93 ± 0.05 | |||||
| Danoudis and Iansek [44] | HD: 17 | 60 ± 10.5 | 47 | 1.71 ± 0.07 | 0.873 ± 0.047 | 40–51† | 25.8 ± 10.63 | 2 | Not stated |
| CO: 21 | 71.7 ± 4 | 62 | 1.66 ± 0.06 | 0.86 ± 0.04 | |||||
| de Tommaso et al. [45] | HD: 24 | 48.13 ± 11.53 | 50 | - | - | 44.33 ± 0 | 37.71 ± 20.21 | - | Age, gender |
| CO: 14 | 48.8 ± 14.13 | 50 | |||||||
| Delval et al. [28] | HD: 15 | 47 ± 11.2 | 53 | 1.68 ± 0.1 | - | 43.6 ± 3.3 | 28.7 ± 22 | 10.9 ± 1.6 | Age, gender |
| CO: 15 | 47.9 ± 11.2 | NS | 1.7 ± 0.1 | ||||||
| Delval et al. [30] | HD: 15 | 43.9 ± 9.8 | 52 | 1.69 ± 0.1 | - | 47 ± 4 | 42 ± 17.1 | 9 ± 2.5 | Gender, age, height |
| CO: 15 | 40.5 ± 10.5 | NS | 1.72 ± 0.09 | ||||||
| Delval et al. [22] | Pre: 17 | 36.5 (29–42) | 50.88 | 1.73 (1.69–1.78) | 0.91 (0.89–0.93) | - | 3 (2–6.25)* | 13 | Age |
| CO: 57 | 38 (29–61)* | 47.37 | 1.73 (1.64–1.77)* | 0.9 (0.87–0.93)* | |||||
| Desai et al. [46] | HD: 33 | 54.7 ± 12.6 | 39.4 | - | - | - | 39 ± 15 | 11 ± 2 | Age, gender |
| CO: 15 | 53.2 ± 13.2 | 46.67 | |||||||
| Gaßner et al. [9] | HD: 43 | 50 ± 11.1 | 41.86 | 1.739 ± 0.09 | - | 44.1 ± 4.2 | 38.2 ± 17.9 | 9.1 ± 3.4 | Age, gender, weight, height |
| CO: 43 | 51 ± 11.3 | 51.12 | 1.737 ± 0.095 | ||||||
| Grimbergen et al. [3] | HD: 45 | 59.1 ± 10.1 | 51.1 | - | - | - | 32.93 | 9.8 | Age |
| CO: 27 | 52.2 ± 8.5 | 60 | |||||||
| Hausdorff et al. [11] | HD: 17 | 46.3 ± 12.8 | 64.7 | 1.85 ± 0.09 | - | - | - | 7.4 ± 3.6 | Gender, weight, height |
| CO: 10 | 34.5 ± 13.4 | 90 | 1.83 ± 0.09 | ||||||
| Hausdorff et al. [10] | HD: 20 | 47 (29–71) | 70 | 1.83 ± 0.02 | - | - | - | > 9, n = 6 | Age, weight, height |
| CO: 16 | 39 (20–74) | 87.5 | 1.83 ± 0.02 | 5–9, n = 7 | |||||
| < 5, n = 8 | |||||||||
| Koller and Trimble [24] | HD: 13 | 55.6‡ | 0 | 1.83 ± 0.02 | - | - | - | - | Not stated |
| CO: 10 | 52.2‡ | NS | 1.83 ± 0.02 | ||||||
| Muratori et al. [47] | HD: 43 | 53.6 ± 11.6 | 41.86 | - | - | - | 40.6 ± 16.4 | 10.6 ± 2.2 | Gender, age |
| CO: 15 | 52.2 ± 13.2 | 46.67 | |||||||
| Purcell et al. [31] | HD: 17 | 55 ± 9.66 | 41.18 | - | - | - | 21.86 ± 9.86 | - | Not stated |
| CO: 17 | 56.47 ± 9.3 | 47.06 | |||||||
| Pyo et al. [25] | HD: 7 | 59.14 ± 12.94 | 57.1 | - | - | 43.14 ± 8.20 | 27.86 ± 8.44 | 5.14 ± 1.96 | Age, gender, weight, height |
| CO: 7 | 55.71 ± 14.58 | NS | |||||||
| Radovanović et al. [27] | HD: 16 | 51.38 ± 9.65 | 50 | - | - | - | - | - | Age, gender |
| CO: 26 | 51.96 ± 8.53 | 50 | |||||||
| Rao et al. [8] | HD: 12 | 50 ± 7.8 | 41.67 | - | - | - | - | 8 ± 4.15 | Age |
| CO: 22 | 41.67 | ||||||||
| Rao et al. [14] | Pre: 15 | 36.92 ± 2.05 | 60 | - | - | 42.84 ± 0.57 | 2.78 ± 1.62 | 13 ± 0 | Age |
| HD: 30 | 48.81 ± 10.22 (HD I) | 40 | 44.25 ± 4.16 | 29.64 ± 11.55 | 11.72 ± 0.78 | ||||
| 53.25 ± 11.21 (HD II) | 50 | 45 ± 0 | 46.33 ± 13.5 | 8.83 ± 1.11 | |||||
| 47.25 ± 8.12 (HD III) | 60 | 46 ± 3.05 | 56.13 ± 15.72 | 5 ± 0.96 | |||||
| CO: 20 | 44.3 ± 9.05 | 60 | |||||||
| Reynolds et al. [23] | HD: 6 | 33–61† | 50 | - | - | - | - | - | Age |
| CO: 30 | NS |
Data presented as mean ± standard deviation, unless otherwise stated.
* data presented as median and range;
† data presented as range only;
‡ data presented as mean only.
TMS, total motor score; TFC, total functional capacity; Pre, premanifest participants; HD, Huntington’s disease; CO, controls; NS, not stated; BMI, body mass index.
- 1. Beckmann H, Bohlen S, Saft C, Hoffmann R, Gerss J, Muratori L, et al. Objective assessment of gait and posture in premanifest and manifest Huntington disease - A multi-center study. Gait Posture 2018;62:451–457.ArticlePubMed
- 2. Collett J, Esser P, Khalil H, Busse M, Quinn L, DeBono K, et al. Insights into gait disorders: walking variability using phase plot analysis, Huntington’s disease. Gait Posture 2014;40:694–700.ArticlePubMed
- 3. Grimbergen YAM, Knol MJ, Bloem BR, Kremer BPH, Roos RAC, Munneke M. Falls and gait disturbances in Huntington’s disease. Mov Disord 2008;23:970–976.ArticlePubMedPDF
- 4. Delval A, Krystkowiak P, Delliaux M, Dujardin K, Blatt JL, Destée A, et al. Role of attentional resources on gait performance in Huntington’s disease. Mov Disord 2008;23:684–689.ArticlePubMedPDF
- 5. Chaganti SS, McCusker EA, Loy CT. What do we know about late onset Huntington’s disease? J Huntingtons Dis 2017;6:95–103.ArticlePubMedPMC
- 6. Roos RA. Huntington’s disease: a clinical review. Orphanet J Rare Dis 2010;5:40.ArticlePubMedPMCPDF
- 7. Rao AK, Mazzoni P, Wasserman P, Marder K. Longitudinal change in gait and motor function in pre-manifest Huntington’s disease. PLoS Curr 2011;3:RRN1268.ArticlePubMedPMC
- 8. Rao AK, Quinn L, Marder KS. Reliability of spatiotemporal gait outcome measures in Huntington’s disease. Mov Disord 2005;20:1033–1037.ArticlePubMed
- 9. Gaßner H, Jensen D, Marxreiter F, Kletsch A, Bohlen S, Schubert R, et al. Gait variability as digital biomarker of disease severity in Huntington’s disease. J Neurol 2020;267:1594–1601.ArticlePubMedPMCPDF
- 10. Hausdorff JM, Cudkowicz ME, Firtion R, Wei JY, Goldberger AL. Gait variability and basal ganglia disorders: stride-to-stride variations of gait cycle timing in Parkinson’s disease and Huntington’s disease. Mov Disord 1998;13:428–437.ArticlePubMed
- 11. Hausdorff JM, Mitchell SL, Firtion R, Peng CK, Cudkowicz ME, Wei JY, et al. Altered fractal dynamics of gait: reduced stride-interval correlations with aging and Huntington’s disease. J Appl Physiol (1985) 1997;82:262–269.ArticlePubMed
- 12. Dierick F, Vandevoorde C, Chantraine F, White O, Buisseret F. Benefits of nonlinear analysis indices of walking stride interval in the evaluation of neurodegenerative diseases. Hum Mov Sci 2021;75:102741.ArticlePubMed
- 13. Quinn L, Khalil H, Dawes H, Fritz NE, Kegelmeyer D, Kloos AD, et al. Reliability and minimal detectable change of physical performance measures in individuals with pre-manifest and manifest Huntington disease. Phys Ther 2013;93:942–956.ArticlePubMedPDF
- 14. Rao AK, Muratori L, Louis ED, Moskowitz CB, Marder KS. Spectrum of gait impairments in presymptomatic and symptomatic Huntington’s disease. Mov Disord 2008;23:1100–1107.ArticlePubMed
- 15. Moon Y, Sung J, An R, Hernandez ME, Sosnoff JJ. Gait variability in people with neurological disorders: a systematic review and meta-analysis. Hum Mov Sci 2016;47:197–208.ArticlePubMed
- 16. Aromataris E, Munn Z. JBI manual for evidence synthesis [Internet]. Adelaide, Australia: JBI Collaboration; 2020. [accessed on 2022 February 24]. Available at: https://synthesismanual.jbi.global.
- 17. Lu C, Louie KH, Twedell EL, Vitek JL, MacKinnon CD, Cooper SE. Overground versus treadmill walking in Parkinson’s disease: relationship between speed and spatiotemporal gait metrics. Gait Posture 2022;93:96–101.ArticlePubMedPMC
- 18. Covidence. Covidence systematic review software [Internet]. Melbourne: Veritas Health Innovation; 2022. [accessed on 2022 April 1]. Available at: https://www.covidence.org/.
- 19. Higgins JP, Thompson SG, Deeks JJ, Altman DG. Measuring inconsistency in meta-analyses. BMJ 2003;327:557–560.ArticlePubMedPMC
- 20. Sterne JA, Sutton AJ, Ioannidis JP, Terrin N, Jones DR, Lau J, et al. Recommendations for examining and interpreting funnel plot asymmetry in meta-analyses of randomised controlled trials. BMJ 2011;343:d4002.ArticlePubMed
- 21. Dalton A, Khalil H, Busse M, Rosser A, van Deursen R, Ólaighin G. Analysis of gait and balance through a single triaxial accelerometer in presymptomatic and symptomatic Huntington’s disease. Gait Posture 2013;37:49–54.ArticlePubMed
- 22. Delval A, Bleuse S, Simonin C, Delliaux M, Rolland B, Destee A, et al. Are gait initiation parameters early markers of Huntington’s disease in pre-manifest mutation carriers? Gait Posture 2011;34:202–207.ArticlePubMed
- 23. Reynolds NC Jr, Myklebust JB, Prieto TE, Myklebust BM. Analysis of gait abnormalities in Huntington disease. Arch Phys Med Rehabil 1999;80:59–65.ArticlePubMed
- 24. Koller WC, Trimble J. The gait abnormality of Huntington’s disease. Neurology 1985;35:1450–1454.ArticlePubMed
- 25. Pyo SJ, Kim H, Kim IS, Park YM, Kim MJ, Lee HM, et al. Quantitative gait analysis in patients with Huntington’s disease. J Mov Disord 2017;10:140–144.ArticlePubMedPMCPDF
- 26. Anwar N, Labuschagne I, Simpson K, Smith L, Georgiou-Karistianis N. Impairments in spatiotemporal gait adaptation during obstacle navigation in Huntington’s disease. Neurorehabil Neural Repair 2017;31:934–943.ArticlePubMedPDF
- 27. Radovanović S, Vodopić S, Stanković I, Dragašević-Mišković N, Kostić V. Spatiotemporal gait characteristics of Huntington’s disease during dualtask walking. Int J Neurosci 2020;130:136–143.ArticlePubMed
- 28. Delval A, Krystkowiak P, Blatt JL, Labyt E, Dujardin K, Destée A, et al. Role of hypokinesia and bradykinesia in gait disturbances in Huntington’s disease: a biomechanical study. J Neurol 2006;253:73–80.ArticlePubMedPDF
- 29. Bilney B, Morris ME, Churchyard A, Chiu E, Georgiou-Karistianis N. Evidence for a disorder of locomotor timing in Huntington’s disease. Mov Disord 2005;20:51–57.ArticlePubMed
- 30. Delval A, Krystkowiak P, Delliaux M, Blatt JL, Derambure P, Destée A, et al. Effect of external cueing on gait in Huntington’s disease. Mov Disord 2008;23:1446–1452.ArticlePubMedPDF
- 31. Purcell NL, Goldman JG, Ouyang B, Liu Y, Bernard B, O’Keefe JA. The effects of dual-task cognitive interference on gait and turning in Huntington’s disease. PLoS One 2020;15:e0226827. ArticlePubMedPMC
- 32. Churchyard AJ, Morris ME, Georgiou N, Chiu E, Cooper R, Iansek R. Gait dysfunction in Huntington’s disease: parkinsonism and a disorder of timing. Implications for movement rehabilitation. Adv Neurol 2001;87:375–385.PubMed
- 33. Novak MJ, Tabrizi SJ. Huntington’s disease: clinical presentation and treatment. Int Rev Neurobiol 2011;98:297–323.ArticlePubMed
- 34. Reilmann R, Leavitt BR, Ross CA. Diagnostic criteria for Huntington’s disease based on natural history. Mov Disord 2014;29:1335–1341.ArticlePubMed
- 35. Constantinou M, Barrett R, Brown M, Mills P. Spatial-temporal gait characteristics in individuals with hip osteoarthritis: a systematic literature review and meta-analysis. J Orthop Sports Phys Ther 2014;44:291–303.B7.ArticlePubMed
- 36. Dumurgier J, Artaud F, Touraine C, Rouaud O, Tavernier B, Dufouil C, et al. Gait speed and decline in gait speed as predictors of incident dementia. J Gerontol A Biol Sci Med Sci 2017;72:655–661.ArticlePubMed
- 37. Collyer TA, Murray AM, Woods RL, Storey E, Chong TT, Ryan J, et al. Association of dual decline in cognition and gait speed with risk of dementia in older adults. JAMA Netw Open 2022;5:e2214647. ArticlePubMedPMC
- 38. Martinez-Horta S, Sampedro F, Horta-Barba A, Perez-Perez J, Pagonabarraga J, Gomez-Anson B, et al. Structural brain correlates of dementia in Huntington’s disease. Neuroimage Clin 2020;28:102415.ArticlePubMedPMC
- 39. Paulsen JS, Long JD, Johnson HJ, Aylward EH, Ross CA, Williams JK, et al. Clinical and biomarker changes in premanifest Huntington disease show trial feasibility: a decade of the PREDICT-HD study. Front Aging Neurosci 2014;6:78.ArticlePubMedPMC
- 40. Pereiro-Buceta H, Becerro-de-Bengoa-Vallejo R, Losa-Iglesias ME, López-López D, Navarro-Flores E, Martínez-Jiménez EM, et al. The effect of simulated leg-length discrepancy on the dynamic parameters of the feet during gait-cross-sectional research. Healthcare (Basel) 2021;9:932.ArticlePubMedPMC
- 41. Huang C, Zhang F, Xu Z, Wei J. The diverse gait dataset: gait segmentation using inertial sensors for pedestrian localization with different genders, heights and walking speeds. Sensors (Basel) 2022;22:1678.ArticlePubMedPMC
- 42. Podvin S, Reardon HT, Yin K, Mosier C, Hook V. Multiple clinical features of Huntington’s disease correlate with mutant HTT gene CAG repeat lengths and neurodegeneration. J Neurol 2019;266:551–564.ArticlePubMedPDF
- 43. Andrzejewski KL, Dowling AV, Stamler D, Felong TJ, Harris DA, Wong C, et al. Wearable sensors in Huntington disease: a pilot study. J Huntingtons Dis 2016;5:199–206.ArticlePubMed
- 44. Danoudis M, Iansek R. Gait in Huntington’s disease and the stride lengthcadence relationship. BMC Neurol 2014;14:161.ArticlePubMedPMCPDF
- 45. de Tommaso M, Ricci K, Montemurno A, Vecchio E, Invitto S. Walkingrelated dual-task interference in early-to-middle-stage Huntington’s disease: an auditory event related potential study. Front Psychol 2017;8:1292.ArticlePubMedPMC
- 46. Desai R, Fritz NE, Muratori L, Hausdorff JM, Busse M, Quinn L. Evaluation of gait initiation using inertial sensors in Huntington’s disease: insights into anticipatory postural adjustments and cognitive interference. Gait Posture 2021;87:117–122.ArticlePubMed
- 47. Muratori LM, Quinn L, Li X, Youdan G, Busse M, Fritz NE. Measures of postural control and mobility during dual-tasking as candidate markers of instability in Huntington’s disease. Hum Mov Sci 2021;80:102881.ArticlePubMed
REFERENCES
Figure & Data
References
Citations
Comments on this article
 PubReader
 ePub Link
 Cite
Cite


