E-submission
Articles
- Page Path
- HOME > J Mov Disord > Early view > Article
-
Original Article
Extraction of the pull force from inertial sensors during the pull test for Parkinson’s disease: A reliability study -
Ryoma Taniuchi1,2

 , Shusaku Kanai3, Amane Hara1, Kazuya Monden1, Hiroaki Nagatani1, Tsuyoshi Torii4, Toshihide Harada3
 -
>
Epub ahead of print
DOI: https://doi.org/10.14802/jmd.23185
Published online: December 15, 2023
1Department of Rehabilitation, National Hospital Organization Hiroshima-Nishi Medical Center, Hiroshima, Japan
2Graduate School of Comprehensive Scientific Research, Prefectural University of Hiroshima, Hiroshima, Japan
3Department of Physical Therapy, Faculty of Health and Welfare, Prefectural University of Hiroshima, Hiroshima, Japan
4Department of Neurology, National Hospital Organization Hiroshima-Nishi Medical Center, Hiroshima, Japan
- Corresponding author: Ryoma Taniuchi, PT, MSc Department of Rehabilitation, National Hospital Organization Hiroshima-Nishi Medical Center, 4-1-1, Kuba, Otake, Hiroshima 739-0696, Japan / Tel: +81-827-57-7151 / Fax: +81-827-57-3681 / E-mail: taniuchi.ryoma.da@mail.hosp.go.jp
Copyright © 2024 The Korean Movement Disorder Society
This is an Open Access article distributed under the terms of the Creative Commons Attribution Non-Commercial License (http://creativecommons.org/licenses/by-nc/4.0/) which permits unrestricted non-commercial use, distribution, and reproduction in any medium, provided the original work is properly cited.
- 889 Views
- 127 Download
ABSTRACT
-
Objective
- To examine the inter- and intra-rater reliability of the pull test in patients with Parkinson’s disease (PD) using the extracted pull force.
-
Methods
- In this inter- and intra-rater reliability study, two raters performed a pull test on 30 patients with PD. The pull force was quantified using inertial sensors attached to the rater’s right hand and the patient’s lower trunk. In this study, the pull force was calculated as an extracted three-dimensional vector quantity, the resultant acceleration, and was expressed in m/s2. Inter- and intra-rater reliabilities were analyzed using the interclass correlation coefficient (ICC) for the pull force and Cohen’s weighted kappa (κw) for the pull test score. Furthermore, Bland–Altman analysis was used to investigate systematic errors.
-
Results
- The inter- and intra-rater reliability of the pull force was very poor (ICC = 0.033–0.214). Bland–Altman analysis revealed no systematic errors in the pull forces between the two test points. Conversely, κw for the pull test scores ranged from 0.763 to 0.920, indicating substantial to almost perfect agreement.
-
Conclusion
- The pull test score was reliable despite variations in the quantified pull force for inter- and intra-rater reliability. Our findings suggest that the pull test is a robust tool for evaluating postural instability in patients with PD and that the pull force probably does not affect scoring performance.
- Parkinson’s disease (PD) is a progressive neurodegenerative disorder characterized by four cardinal motor symptoms: resting tremor, bradykinesia, rigidity, and postural instability. As the disease progresses, balance impairment and falls become increasingly significant, presenting a major challenge for patients with PD and their caregivers [1]. Patients with PD are more vulnerable to backward falls [2,3], and fall-related negative effects can significantly impair their quality of life [4-7].
- The pull test is the gold standard for the clinical evaluation of postural instability in PD patients, and its execution and interpretation are standardized by the Movement Disorder Society-sponsored revision of the Unified Parkinson’s Disease Rating Scale (MDS-UPDRS) part III, item 12 [8]. In this test, the rater must sufficiently displace the center of gravity (COG) by briskly and forcefully pulling the patient’s shoulder, requiring the patient to take at least one step backwards. Although a five-point scale ranging from 0 to 4 is subjective, it has been shown to be correlated with quantitative stability measures, such as the stability margin in response to backward body sway and backward displacement of the COG [2]. However, despite its universal use in clinical settings and trials [9], few studies have shown that variability in the rater pull force affects test–retest reliability (i.e., random noise and rater bias) [10-12]. Adequate training is recommended prior to the implementation of the pull test [11]; however, errors in pull force are reported for > 80% of the raters [12], and the test has only moderate inter- and intra-rater reliability [13].
- Biomechanical studies have been conducted to establish a robust clinical method for evaluating postural instability in PD patients. Quantitative perturbations using reproducible mechanically generated pull forces that emulate the pull test have been used to induce a step backward in laboratory settings, such as floor surface translations [2,14-16] or direct pulling via a harness-connected cable [3,17-19]. According to a biomechanical analysis of the pull test, the least pull force required to take a step backward in patients with moderate PD may be less than that in patients with mild PD or healthy controls [19], but another study showed no difference [3]. There is controversy regarding the clinical utility of the pull test, and it is unknown whether the variability in the pull force affects the scoring performance. However, despite the test being performed in a clinical setting, efforts have not been made to quantify the pull force generated by the rater’s hand.
- In our experience, less experienced raters tend to have difficulty pulling briskly and forcefully, likely because of concerns about failing to catch the patient. This might lead to bias in the pull test score, as raters can influence the behavioral response of patients with PD by purposefully pulling at various strengths. This study presents a method in which inertial sensors are used to measure clinical pull force during a pull test in patients with PD. Therefore, the primary aim of this study was to examine the inter- and intra-rater reliability of the pull test in patients with PD using the extracted pull force. We hypothesized that the pull force would differ significantly within the inter-rater category and affect the scoring performance in the pull test.
INTRODUCTION
- Participants
- Patients with idiopathic PD who were clinically diagnosed by a neurologist were recruited from the National Hospital Organization in Japan between December 2022 and June 2023. The inclusion criteria were as follows: 1) patient had a modified Hoehn and Yahr scale score [20] of 2–4 during the ON medication state and 2) patient had the ability to walk independently with or without a walking aid. The exclusion criteria were as follows: 1) patient had uncontrolled severe DOPA-related motor/nonmotor complications; 2) patient had a Mini-Mental State Examination (MMSE) score < 24 (cognitive decline with incapacity to consent); and 3) patient had orthopedic, respiratory, cardiovascular, or other chronic comorbidities that would interfere with the safety and conduct of the test.
- The required study sample size was determined to be 30 participants based on the COnsensus-based Standards for the selection of health status Measurement Instruments (COSMIN) checklist [21]. This sample size aligns with the moderate sample size recommended by the COSMIN for assessing inter-rater agreement and reliability [22]. The study was approved by the National Hospital Organization Hiroshima-Nishi Medical Center’s Committee of Ethics in Research (No. 2022-018), and all participants provided written informed consent before enrollment.
- Experimental procedure
- Two raters performed the pull test on all patients during the study period. The raters were certified physical therapists for neuromuscular disorders with 10 (Rater 1; male, weight = 79.9 kg) and 3 (Rater 2; female, weight = 51.0 kg) years of clinical experience in treating patients with PD, separately. The raters complied with the instructions on the MDS-UPDRS part III for executing the pull test [8]. They explained how to avoid falling and used the first pull as an instructed demonstration to the patient. Because the participants in this study were patients who could walk independently with or without a walking aid, none of them met the criterion for a pull test score of 4 (severe).
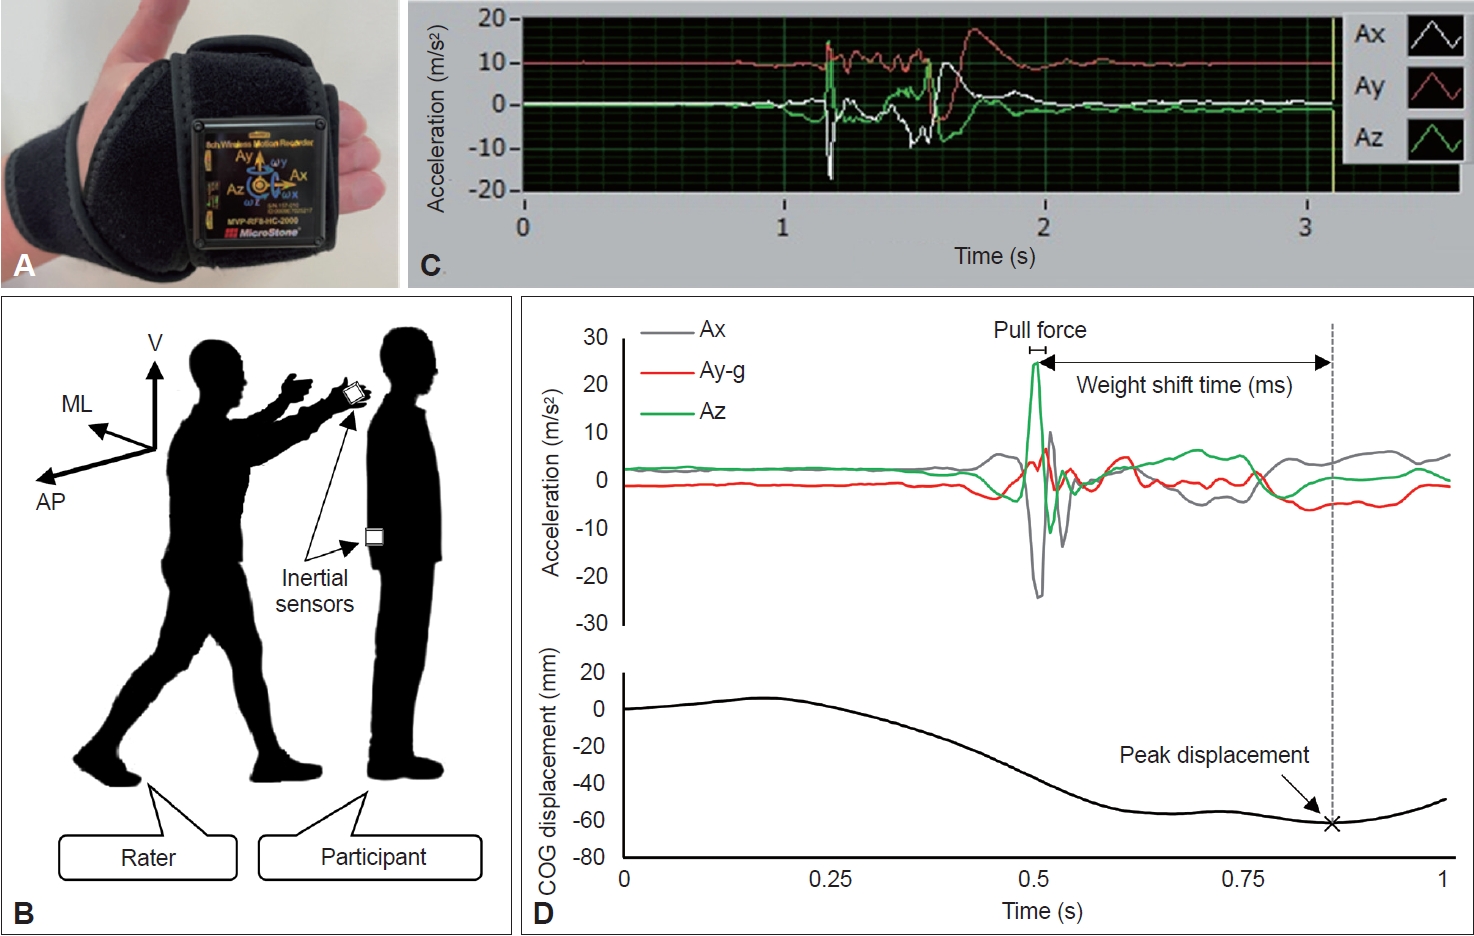
- The force exerted during the pull test was quantified using two inertial sensors (MVP-RF8-HC; MicroStone Co., Nagano, Japan). Each wireless motion recorder was a small device equipped with a gyro-accelerometer at a sampling rate of 200 Hz (Figure 1A). One inertial sensor was attached to the dorsal surface of the rater’s right second to fifth fingers using a hook-and-loop fastener, and the other was attached to the level of the patient’s L3 spinous process as a virtual COG [23] with a similar fastener (Figure 1B). Three-dimensional spatiotemporal signals, namely, medial-lateral (X-axis), vertical (Y-axis), and anterior-posterior (Z-axis) accelerations and displacements, were sampled and transmitted via Bluetooth to a personal computer.
- Each patient underwent two pull-test trials per rater (i.e., four pull-test trials each). Demographic and clinical data, including medication history, were collected before the pull test trial. The MDS-UPDRS part III scores were subdivided into four subscores [9]. We then performed the pull test once per rater during Test Session 1 and retested during Test Session 2 with a 2- to 28- day interval between sessions. The order of the raters’ trials was randomized in each test session. Moreover, the experimental conditions were similar for all trials, and there was an adequate break of several minutes between trials. To minimize differences in the performance of the pull test, all tests were performed in the ON medication state, and no adjustments were made to dopaminergic medication during the study period. The average duration between test and retest sessions was 6.1 days.
- Data processing
- The raw spatiotemporal data were processed using Microsoft Excel. In this study, the pull force was calculated as an extracted three-dimensional vector quantity, the resultant acceleration, and was expressed in m/s2. Before the analysis, to prioritize the extraction of pure biomechanical phenomena, the three-axis acceleration data were high-pass filtered, and gravitational acceleration was subtracted from the vertical component. To calculate the resultant acceleration, we first identified the peak value of acceleration in the anterior-posterior direction, which provides information on the magnitude of acceleration in a clinical event in which the rater pulls the patient’s shoulder backwards. The waveform of acceleration in the anterior-posterior direction from the inertial sensor attached to the rater’s right hand showed a typical sharp peak, reflecting clinical pulling, identified from the positive acceleration following the baseline (Figure 1C). To mitigate signal artifacts, the mean value, rather than the peak value, was adopted as the acceleration for the pull force; this was computed using the average acceleration of each axis for 20 ms (i.e., five samples) centered around the peak acceleration in the anterior-posterior direction. Thus, the pull force was expressed as the resultant acceleration according to the following formula:
- where Ax is the average acceleration of the X-axis, Ay is the average acceleration of the Y-axis, g is the gravitational acceleration (i.e., 9.8 m/s2), and Az is the average acceleration of the Z-axis.
- We investigated spatiotemporal parameters and the pull force and score as pull test performance parameters (Figure 1D). As a spatial parameter, we analyzed the maximum posterior displacement of the COG (COG-P) during the pull test using an inertial sensor attached to the patient’s lower trunk as a virtual COG. The COG-P score was defined as the peak displacement from pull onset to recapture of the unaided falling body. Because the patient’s behavioral responses to the expected pulling varied [3], some patients had a slight displacement of the COG prior to pulling, as shown in Figure 1D. However, unless abnormal trunk flexion occurred, displacement of the COG prior to pulling was recognized as an in-place response within the error range [18]. Furthermore, two peak values (acceleration of the Z-axis and COG-P) were used as temporal parameters to define the weight shift time (WST). The WST is prolonged even in patients with mild PD in whom postural instability is not clinically diagnosed, suggesting that the WST may serve as an early biomarker of postural instability [17]. The detection of these spatiotemporal parameters was unfeasible in patients who fell if not caught by the rater, namely, those with a pull test score of 3.
- Statistical analysis
- One of the aims of this study was to investigate whether the extracted pull force is associated with the pull test score or other clinical data. After assessing the normality of the distributions, one-way analysis of variance (ANOVA) or the Kruskal–Wallis test was conducted to compare the differences among the pull forces grouped by the pull test scores. Furthermore, we used Spearman’s rank correlation coefficient to explore the associations between the extracted parameters and clinical data.
- The inter- and intra-rater reliability of the pull force tests were analyzed using both relative and absolute reliability measures. The relative reliability of the pull force was evaluated using the interclass correlation coefficient (ICC). Specifically, we calculated the ICC1,1 to analyze intra-rater reliability, focusing on the consistency of the measurements within Test Sessions 1 and 2. The ICC1,1 allows us to ascertain the extent to which a single rater can reliably replicate the pull force over time. Similarly, we calculated the ICC2,1 to analyze inter-rater reliability, focusing on the agreement between the measurements taken during Test Session 1 and those taken in Test Session 2. ICC2,1 is pivotal for assessing the generalizability and robustness of the pull force across different raters. A high ICC2,1 suggests that the specific rater does not heavily influence the measurements and can be considered reliable across a broader spectrum of raters. The ICCs were interpreted as follows: coefficient < 0.5 = poor reliability; 0.5–0.75 = moderate reliability; 0.76–0.9 = good reliability; and > 0.90 = excellent reliability [24]. To determine the absolute reliability of the pull force, the standard measurement error (SEM) was calculated, and Bland–Altman analysis was used to investigate the systematic error. The SEM was calculated using the following formula:
- where SDdiff is the standard deviation of the difference between the two measurements. In the Bland–Altman plot, two types of systematic errors (fixed bias and proportional bias) were assessed based on the differences between the two measurements and the mean of the two measurements [25]. First, fixed bias was determined to exist when the 95% confidence interval of the difference between two measurements did not reach zero. Second, proportional bias was determined to exist when the slope of the regression line fitted to the plot was statistically significant.
- Similarly, the inter- and intra-rater agreements of the pull test score were analyzed using Cohen’s weighted kappa (κw) because of the ordinal data. The κw was interpreted as follows: coefficient in the range of 0.61–0.80 = substantial agreement and 0.81–1.00 = almost perfect agreement [26]. To compare the results with those of other reliability studies, we also calculated the SEM-related percentage (%SEM) obtained by dividing the SEM by the mean of the measurements from the two compared tests and multiplying by 100.
- All the statistical analyses were conducted using IBM SPSS Statistics version 26 (IBM Corp., Armonk, NY, USA), with the significance set at 5%.
MATERIALS & METHODS
- Thirty patients with PD (15 females, mean age: 72.4 ± 8.5 years, mean weight: 51.3 ± 11.1 kg) participated in the study. The participants’ characteristics are presented in Table 1. All participants completed four pull-test trials. No adverse events or falls occurred during the study period. Seven patients had a pull test score of 3, and their COG-P and WST parameters were excluded from the analyses.
- Relationships between the extracted parameters and clinical data
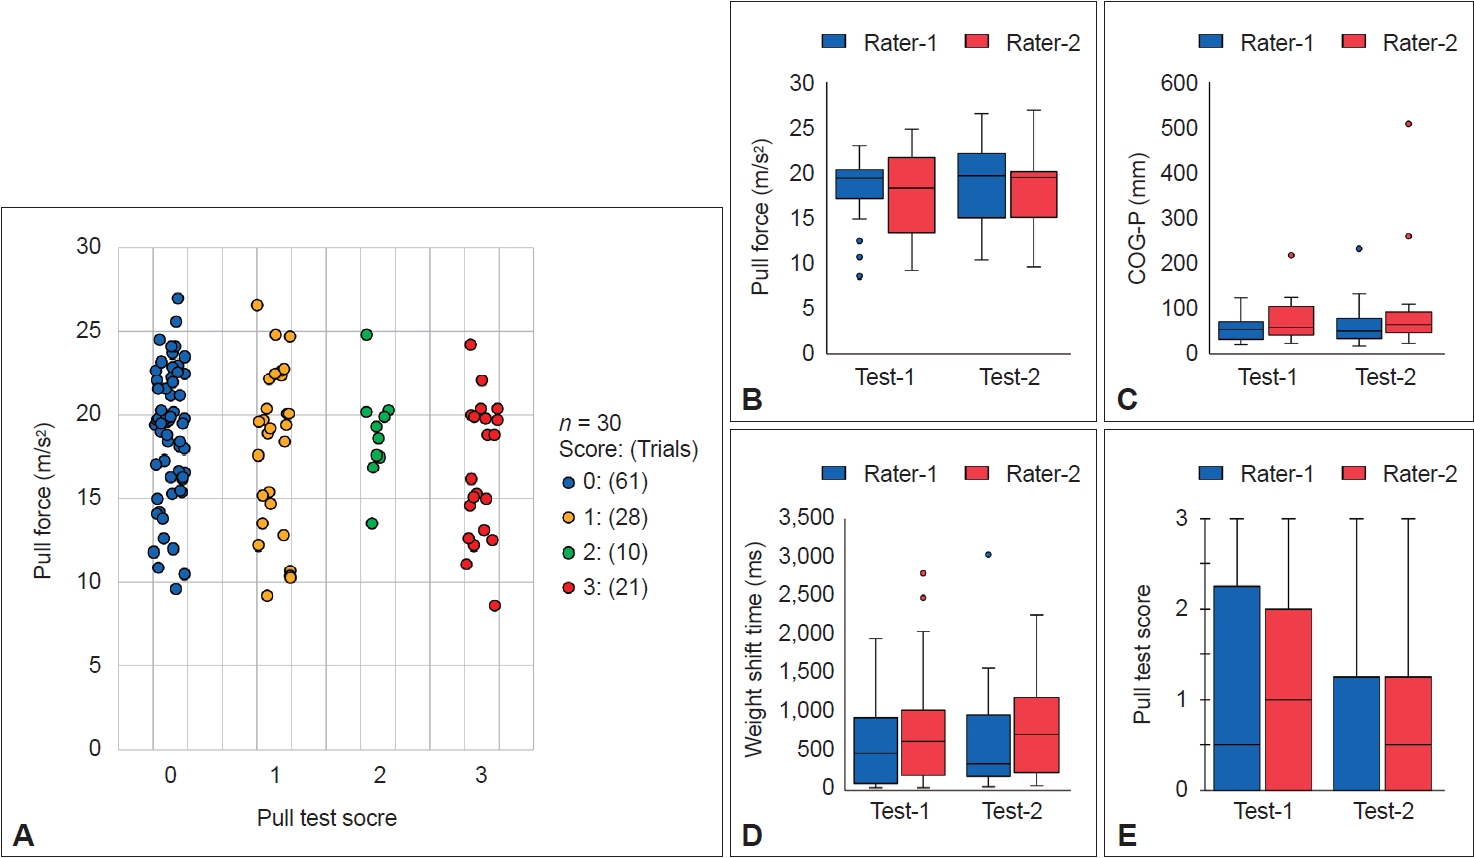
- The pull test scores and extracted parameters are shown in Figure 2. The pull forces corresponding to each pull test score group were as follows: 0 (18.9 ± 3.9 m/s2), 1 (18.1 ± 4.9 m/s2), 2 (18.9 ± 2.9 m/s2), and 3 (16.7 ± 4.1 m/s2). Importantly, no significant differences were observed between the groups (oneway ANOVA, p = 0.183) (Figure 2A). Similarly, no significant differences emerged between the pull test performance parameters and the raters or test sessions, suggesting that the divergence in performance across the four trials was minimal (Figure 2B-E). The pull forces corresponding to the raters and test sessions were as follows: Rater 1–Test 1 (18.6 ± 3.5 m/s2), Rater 2–Test 1 (17.7 ± 4.5 m/s2), Rater 1–Test 2 (18.7 ± 4.3 m/s2), and Rater 2–Test 2 (18.4 ± 4.4 m/s2).
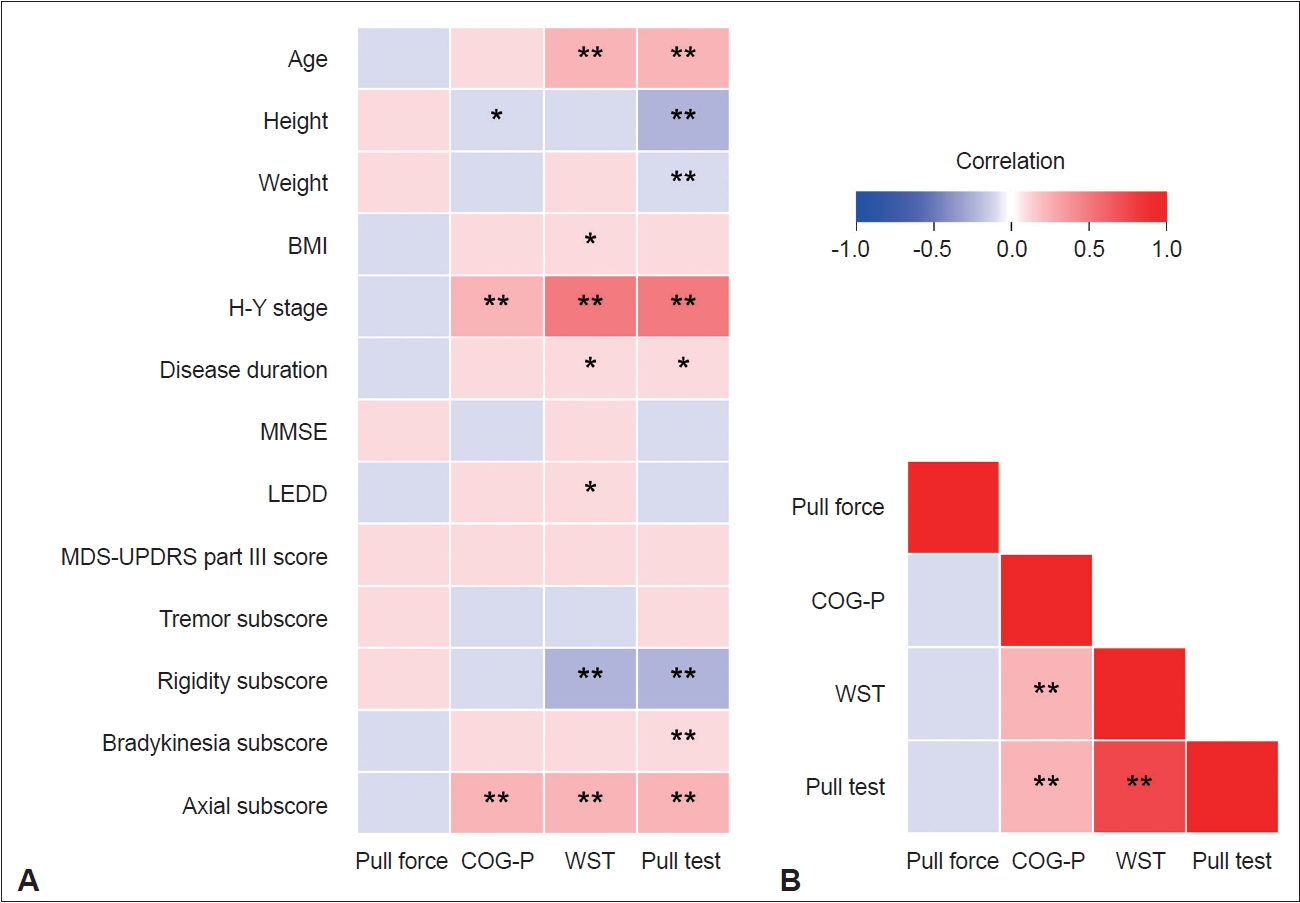
- The results of the correlation analyses are summarized in Figure 3. No significant correlation was observed between the pull force and any other parameter. The pull test score correlated with the COG-P (rs = 0.480, p < 0.001) and WST (rs = 0.805, p < 0.001) scores and exhibited a moderate correlation with severity and axial symptoms according to clinical characteristics. Additionally, the difference in body weight between the patients and the raters did not correlate with the pull force (Supplementary Figure 1 in the online-only Data Supplement).
- Inter- and intra-rater reliability of the pull force
- Table 2 shows the inter- and intra-rater reliability of the pull force. The ICC1,1 for the intra-rater reliability of the pull force was 0.137–0.214 (SEM = 4.0–4.2), and the ICC2,1 for the interrater reliability was 0.033–0.189 (SEM = 3.6–4.3), indicating very poor reliability. Additionally, Bland–Altman analysis revealed no systematic errors between the pull forces at the two test points.
- Inter- and intra-rater agreement of the pull test scores
- Table 3 shows the results for the inter- and intra-rater reliability of the pull test scores. The κw for the intra-rater agreement of the pull test score was 0.763–0.920 (p < 0.001), while that for the inter-rater agreement was 0.786–0.912 (p < 0.001), indicating substantial to almost perfect agreement. Overall, the variability in the %SEM between the tests and retests was significant, indicating a particularly high error in the retest.
RESULTS
- This study investigated whether variability in pull force affects scoring performance in the clinical pull test. The main findings of this study were as follows: 1) the quantified inter- and intrarater pull forces varied greatly, indicating very poor reliability; and 2) contrary to our hypothesis, the scoring performance was reliable. To the best of our knowledge, this is the first study to quantify the pull force clinically generated by a rater’s hand and to evaluate the reliability of the pull test in patients with PD.
- In recent biomechanical studies, reproducible mechanically generated pull forces have been employed to quantify perturbations [3,19]. However, these methodologies primarily focused on exploring the least pull force required to take a step backward. Despite the pull test being performed in clinical settings, only a few studies have used perturbations generated by the rater’s hand [27,28]. A significant concern regarding perturbations in which raters perform a shoulder pull is the variability of the pull force introduced by bias from purposefully pulling at various strengths or by variations in the severity and physique of patients [11,13]. Indeed, for both inter- and intra-rater reliability, the reliability of the pull force was very poor. Given that discrepancies in pull force are present in > 80% of raters [12], standardizing the pull force of the clinical pull test across patients of varying heights, weights, and severity seems difficult [11,13]. However, Bland–Altman analysis did not reveal any systematic errors. Consequently, the observed variability in the pull force likely comprises random errors. Furthermore, we found that the quantified pull force did not significantly differ among the pull test score groups and was unrelated to the extracted parameters or clinical data. These findings imply that although the clinical pull force generated by the rater’s hand exhibited variability, no specific bias was detected.
- The κw for the inter- and intra-rater reliability of the clinical pull test scores were in the 0.763–0.920 range, which was higher than expected. Our results are consistent with previous studies reporting an inter-rater κw of 0.84–0.93 for the pull test score [10]. The %SEM of the pull test was better for Rater 1 than for Rater 2 and for Test Session 1 than for Test Session 2. One possible explanation for this difference in %SEM could be the differences in the techniques used associated with the clinical experience of the raters. Because patients with PD experience fluctuations in various symptoms, less experienced raters may not be able to pull forcefully, leading to an overestimation of the patient’s performance (i.e., higher SEM) [28]. However, no significant differences were observed in the inter-rater pull force, and this study did not focus on distinctions in the raters’ clinical experience or technical proficiency. Therefore, further studies are required to clarify these issues. The first pull test trial responses differed from the retest trial responses [29] and were reported to be better predictors of postural stability [10]. This disparity in behavioral responses may stem from the confounding influence of habituation or motor learning over successive testing sessions [30]. Thus, tracking this error stemming from variations in inter- and intrarater performance may contribute to the establishment of adequate training prior to performing the pull test [11].
- Based on our results, it can be argued that the pull test is a robust metric that is unaffected by clinical pull force. In line with the findings of a previous study [27], we demonstrated that the capacity for decision-making similarly had no discernible effect on the behavioral response in the clinical pull test. The mean MMSE score of the PD participants was 26.9 ± 1.9. Despite the participants exhibiting mild cognitive impairment, no correlations were evident with the pull test performance parameters. Thus, as reported by Kimmell et al. [3], these findings might substantiate the observation that the utility of the pull test in PD patients is not related to the force needed to pull the patient of balance but rather to the behavioral response to being pulled off balance. The pathokinesiological mechanism underlying postural instability that affects the behavioral response to being pulled off balance is presumably difficulty in switching from an in-place response to a stepping response due to excessive trunk, hip, and ankle muscle co-contraction [31-33]. These findings could partially explain why taking at least one step backward in the pull test is most important.
- This study has several limitations. First, the extraction of the pull force was conducted only with the rater’s right hand. Although both raters were right-handed, bimanual pull forces may have been more variable. Second, the pull force was calculated as the acceleration, and the significance of mass was not considered in the equation F = ma. A major limitation to the pull test, when performed using a shoulder pull, is the variability of the pull force introduced by variations in the weight of the patient and rater [11]. Therefore, inter-rater differences in the “true” pull force may be substantial when considering mass (i.e., body weight). However, the difference in body weight between the patients and the raters did not correlate with the pull force in this study. Finally, this study was conducted at a single center. Consequently, larger datasets comprising various PD populations or raters are needed to generalize these results.
- In conclusion, our findings provide preliminary evidence that the pull test is robust and reliable. The pull force probably did not affect the scoring performance as much as expected. The pull test does not require specific equipment and can be easily used to evaluate postural instability in patients with PD in a clinical setting. Although additional studies are needed to resolve the controversial debate on the use of the pull test, it remains the gold standard.
DISCUSSION
Supplementary Materials
Supplementary Figure 1.
-
Conflicts of Interest
The authors have no financial conflicts of interest.
-
Funding Statement
None
-
Author Contributions
Conceptualization: Ryoma Taniuchi, Shusaku Kanai, Toshihide Harada. Data curation: Ryoma Taniuchi, Amane Hara, Kazuya Monden, Hiroaki Nagatani, Tsuyoshi Torii. Formal analysis: Ryoma Taniuchi, Shusaku Kanai, Toshihide Harada. Investigation: Ryoma Taniuchi, Amane Hara, Kazuya Monden, Hiroaki Nagatani, Tsuyoshi Torii. Methodology: all authors. Project administration: all authors. Supervision: Ryoma Taniuchi, Shusaku Kanai, Hiroaki Nagatani, Tsuyoshi Torii, Toshihide Harada. Writing—original draft: Ryoma Taniuchi, Shusaku Kanai. Writing—review & editing: all authors.
Notes
- We thank all of the staff at the National Hospital Organization Hiroshima-Nishi Medical Center for their assistance with data collection.
Acknowledgments

- 1. Bloem BR, Hausdorff JM, Visser JE, Giladi N. Falls and freezing of gait in Parkinson’s disease: a review of two interconnected, episodic phenomena. Mov Disord 2004;19:871–884.ArticlePubMed
- 2. Horak FB, Dimitrova D, Nutt JG. Direction-specific postural instability in subjects with Parkinson’s disease. Exp Neurol 2005;193:504–521.ArticlePubMed
- 3. Kimmell K, Pulusu VK, Bharucha KJ, Ross ED. Postural instability in Parkinson disease: to step or not to step. J Neurol Sci 2015;357:146–151.ArticlePubMed
- 4. Dibble LE, Lange M. Predicting falls in individuals with Parkinson disease: a reconsideration of clinical balance measures. J Neurol Phys Ther 2006;30:60–67.PubMed
- 5. Pickering RM, Grimbergen YA, Rigney U, Ashburn A, Mazibrada G, Wood B, et al. A meta-analysis of six prospective studies of falling in Parkinson’s disease. Mov Disord 2007;22:1892–1900.ArticlePubMed
- 6. Gazibara T, Kisic-Tepavcevic D, Svetel M, Tomic A, Stankovic I, Kostic VS, et al. Indoor and outdoor falls in persons with Parkinson’s disease after 1 year follow-up study: differences and consequences. Neurol Sci 2016;37:597–602.ArticlePubMedPDF
- 7. Kerr GK, Worringham CJ, Cole MH, Lacherez PF, Wood JM, Silburn PA. Predictors of future falls in Parkinson disease. Neurology 2010;75:116–124.ArticlePubMed
- 8. Goetz CG, Tilley BC, Shaftman SR, Stebbins GT, Fahn S, Martinez-Martin P, et al. Movement Disorder Society-sponsored revision of the unified Parkinson’s disease rating scale (MDS-UPDRS): scale presentation and clinimetric testing results. Mov Disord 2008;23:2129–2170.ArticlePubMedPDF
- 9. Taniuchi R, Harada T, Nagatani H, Makino T, Watanabe C, Kanai S. The power of instruction on retropulsion: a pilot randomized controlled trial of therapeutic exercise focused on ankle joint movement in Parkinson’s disease. Clin Park Relat Disord 2022;7:100151.ArticlePubMedPMC
- 10. Visser M, Marinus J, Bloem BR, Kisjes H, van den Berg BM, van Hilten JJ. Clinical tests for the evaluation of postural instability in patients with Parkinson’s disease. Arch Phys Med Rehabil 2003;84:1669–1674.PubMed
- 11. Nonnekes J, Goselink R, Weerdesteyn V, Bloem BR. The retropulsion test: a good evaluation of postural instability in Parkinson’s disease? J Parkinsons Dis 2015;5:43–47.ArticlePubMed
- 12. Munhoz RP, Li JY, Kurtinecz M, Piboolnurak P, Constantino A, Fahn S, et al. Evaluation of the pull test technique in assessing postural instability in Parkinson’s disease. Neurology 2004;62:125–127.ArticlePubMed
- 13. Bloem BR, Beckley DJ, van Hilten BJ, Roos RA. Clinimetrics of postural instability in Parkinson’s disease. J Neurol 1998;245:669–673.ArticlePubMedPDF
- 14. de Kam D, Nonnekes J, Oude Nijhuis LB, Geurts AC, Bloem BR, Weerdesteyn V. Dopaminergic medication does not improve stepping responses following backward and forward balance perturbations in patients with Parkinson’s disease. J Neurol 2014;261:2330–2337.ArticlePubMedPDF
- 15. Lu C, Louie KH, Stutz AM, MacKinnon CD, Cooper SE. Postural instability in Parkinson’s disease assessed with clinical “pull test” and standardized postural perturbations: effect of medication and body weight support. J Neurol 2023;270:386–393.ArticlePubMedPMCPDF
- 16. Herbers C, Schroeder J, Lu C, Geng H, Zhang R, Mehregan J, et al. Dopamine replacement therapy normalizes reactive step length to postural perturbations in Parkinson’s disease. Gait Posture 2023;101:95–100.ArticlePubMedPMC
- 17. McVey MA, Amundsen S, Barnds A, Lyons KE, Pahwa R, Mahnken JD, et al. The effect of moderate Parkinson’s disease on compensatory backwards stepping. Gait Posture 2013;38:800–805.ArticlePubMed
- 18. Di Giulio I, St George RJ, Kalliolia E, Peters AL, Limousin P, Day BL. Maintaining balance against force perturbations: impaired mechanisms unresponsive to levodopa in Parkinson’s disease. J Neurophysiol 2016;116:493–502.ArticlePubMedPMC
- 19. Pérez-Sánchez JR, Grandas F. Early postural instability in Parkinson’s disease: a biomechanical analysis of the pull test. Parkinsons Dis 2019;2019:6304842.PubMedPMC
- 20. Goetz CG, Poewe W, Rascol O, Sampaio C, Stebbins GT, Counsell C, et al. Movement Disorder Society Task Force report on the Hoehn and Yahr staging scale: status and recommendations. Mov Disord 2004;19:1020–1028.PubMed
- 21. Mokkink LB, Terwee CB, Gibbons E, Stratford PW, Alonso J, Patrick DL, et al. Inter-rater agreement and reliability of the COSMIN (COnsensusbased Standards for the selection of health status Measurement Instruments) checklist. BMC Med Res Methodol 2010;10:82.ArticlePubMedPMCPDF
- 22. Terwee CB, Mokkink LB, Knol DL, Ostelo RW, Bouter LM, de Vet HC. Rating the methodological quality in systematic reviews of studies on measurement properties: a scoring system for the COSMIN checklist. Qual Life Res 2012;21:651–657.ArticlePubMedPMCPDF
- 23. Moe-Nilssen R. A new method for evaluating motor control in gait under real-life environmental conditions. Part 2: gait analysis. Clin Biomech (Bristol, Avon) 1998;13:328–335.ArticlePubMed
- 24. Koo TK, Li MY. A guideline of selecting and reporting intraclass correlation coefficients for reliability research. J Chiropr Med 2016;15:155–163.ArticlePubMedPMC
- 25. Ludbrook J. Statistical techniques for comparing measurers and methods of measurement: a critical review. Clin Exp Pharmacol Physiol 2002;29:527–536.ArticlePubMed
- 26. Kundel HL, Polansky M. Measurement of observer agreement. Radiology 2003;228:303–308.ArticlePubMed
- 27. Virmani T, Patra M, Glover A, Pillai L. Objective quantification of responses to the clinical pull-test in people with Parkinson’s disease. Gait Posture 2023;103:106–112.ArticlePubMed
- 28. Daly S, Hanson JT, Mavanji V, Gravely A, Jean J, Jonason A, et al. Using kinematics to re-define the pull test as a quantitative biomarker of the postural response in normal pressure hydrocephalus patients. Exp Brain Res 2022;240:791–802.ArticlePubMedPDF
- 29. Tan JL, Perera T, McGinley JL, Yohanandan SAC, Brown P, Thevathasan W. Neurophysiological analysis of the clinical pull test. J Neurophysiol 2018;120:2325–2333.ArticlePubMedPMC
- 30. Bloem BR, Grimbergen YA, Cramer M, Willemsen M, Zwinderman AH. Prospective assessment of falls in Parkinson’s disease. J Neurol 2001;248:950–958.ArticlePubMedPDF
- 31. Smulders K, Esselink RA, De Swart BJ, Geurts AC, Bloem BR, Weerdesteyn V. Postural inflexibility in PD: does it affect compensatory stepping? Gait Posture 2014;39:700–706.ArticlePubMed
- 32. Dimitrova D, Horak FB, Nutt JG. Postural muscle responses to multidirectional translations in patients with Parkinson’s disease. J Neurophysiol 2004;91:489–501.ArticlePubMed
- 33. Colebatch JG, Govender S. Responses to anterior and posterior perturbations in Parkinson’s disease with early postural instability: role of axial and limb rigidity. Exp Brain Res 2019;237:1853–1867.ArticlePubMedPDF
REFERENCES
Figure & Data
References
Citations
Comments on this article
 PubReader
 ePub Link
 Cite
Cite