E-submission
Articles
- Page Path
- HOME > J Mov Disord > Volume 17(1); 2024 > Article
-
Original Article
Retinal Thinning as a Marker of Disease Severity in Progressive Supranuclear Palsy -
Yueting Chen1,2*
 , Haotian Wang1*, Bo Wang1*, Wenbo Li3,4, Panpan Ye3,4, Wen Xu3,4, Peng Liu1,5, Xinhui Chen1, Zhidong Cen1, Zhiyuan Ouyang1, Sheng Wu1, Xiaofeng Dou5, Yi Liao6, Hong Zhang6,7,8
 , Mei Tian6,9, Wei Luo1
 -
Journal of Movement Disorders 2024;17(1):55-63.
DOI: https://doi.org/10.14802/jmd.23102
Published online: September 26, 2023
1Department of Neurology, The Second Affiliated Hospital, Zhejiang University School of Medicine, Hangzhou, Zhejiang, China
2Department of Ultrasound, Zhejiang Cancer Hospital, Hangzhou Institute of Medicine (HIM), Chinese Academy of Sciences, Hangzhou, Zhejiang, China
3Department of Eye Center, The Second Affiliated Hospital, Zhejiang University School of Medicine, Hangzhou, Zhejiang, China
4Zhejiang Provincial Key Lab of Ophthalmology, Hangzhou, Zhejiang, China
5Department of Neurology, Sir Run Run Shaw Hospital, Zhejiang University School of Medicine, Hangzhou, Zhejiang, China
6Department of Nuclear Medicine and PET-CT Center, The Second Affiliated Hospital, Zhejiang University School of Medicine, Hangzhou, Zhejiang, China
7Key Laboratory for Biomedical Engineering of Ministry of Education, Zhejiang University, Hangzhou, Zhejiang, China
8The College of Biomedical Engineering and Instrument Science, Zhejiang University, Hangzhou, Zhejiang, China
9Huashan Hospital and Human Phenome Institute, Fudan University, Shanghai, China
- Corresponding author: Wei Luo, MD, PhD Department of Neurology, The Second Affiliated Hospital, Zhejiang University School of Medicine, 88 Jiefang Road, Hangzhou, Zhejiang 310009, China / Tel: +86-571-87783777 / Fax: +86-571-87784556 / E-mail: luoweirock@zju.edu.cn
- Corresponding author: Hong Zhang, MD Department of Nuclear Medicine and PET-CT Center, The Second Affiliated Hospital, Zhejiang University School of Medicine, 88 Jiefang Road, Hangzhou, Zhejiang 310009, China / Tel: +86-571-87951479 / E-mail: hzhang21@zju.edu.cn
- Corresponding author: Mei Tian, MD, PhD Huashan Hospital and Human Phenome Institute, Fudan University, 220 Handan Road, Shanghai 200433, China / Tel: +86-13606606388 / E-mail: tianmei@fudan.edu.cn
- *These authors contributed equally to this work.
Copyright © 2024 The Korean Movement Disorder Society
This is an Open Access article distributed under the terms of the Creative Commons Attribution Non-Commercial License (http://creativecommons.org/licenses/by-nc/4.0/) which permits unrestricted non-commercial use, distribution, and reproduction in any medium, provided the original work is properly cited.
ABSTRACT
-
Objective
- Progressive supranuclear palsy (PSP) involves a variety of visual symptoms that are thought to be partially caused by structural abnormalities of the retina. However, the relationship between retinal structural changes, disease severity, and intracranial alterations remains unknown. We investigated distinct retinal thinning patterns and their relationship with clinical severity and intracranial alterations in a PSP cohort.
-
Methods
- We enrolled 19 patients with PSP (38 eyes) and 20 age-matched healthy controls (40 eyes). All of the participants underwent peripapillary and macular optical coherence tomography. Brain 11C-2β-carbomethoxy-3β-(4-fluorophenyl) tropane (11C-CFT) and 18F-fluorodeoxyglucose (18F-FDG) positron emission tomography imaging were also performed in patients with PSP. We investigated the association between retinal thickness changes and clinical features, striatal dopamine transporter availability, and cerebral glucose metabolism.
-
Results
- The peripapillary retinal nerve fiber layer (pRNFL) and macula were significantly thinner in patients with PSP than in controls. The thickness of the superior sector of the pRNFL demonstrated a significant negative relationship with the Movement Disorder Society-Unified Parkinson’s Disease Rating Scale part III and Hoehn and Yahr staging scale scores. A significant negative correlation was found between outer inferior macular thickness and disease duration. Outer temporal macular thickness was positively correlated with Montreal Cognitive Assessment scores. In PSP, lower outer temporal macular thickness was also positively correlated with decreased dopamine transporter binding in the caudate.
-
Conclusion
- The pRNFL and macular thinning may be candidate markers for monitoring disease severity. Additionally, macular thinning may be an in vivo indicator of nigrostriatal dopaminergic cell degeneration in PSP patients.
- Progressive supranuclear palsy (PSP) is a rare progressive neurodegenerative disease that is linked to an abnormal accumulation of four microtubule-binding repeats (4R-tau). It is one of the atypical parkinsonisms, and common clinical features include postural instability, supranuclear gaze palsy, progressive axial rigidity, and bulbar palsy, among other manifestations. In addition, PSP patients experience visual symptoms, which negatively impact daily life [1]. PSP patients frequently experience blurred vision, diplopia [2], photophobia, and visuospatial deficits [3]; moreover, electrophysiological examinations have exhibited abnormal visual event-related potentials [4]. The various visual symptoms suggest not only oculomotor dysfunction but also abnormalities in the retina and central processing mechanisms in PSP patients. Notably, the prevalence of photophobia in patients with PSP varies from 43% to 100% (depending on the evaluation tool that is used), which is significantly higher than that in patients with Parkinson’s disease (PD) and corticobasal degeneration [5,6]. It has been shown that intrinsically photosensitive retinal ganglion cells (ipRGCs) in the retina play an important role in photophobia [5]. However, it remains unknown as to whether photophobia in patients with PSP is related to retinal thickness.
- Embryologically, the retina is part of the central nervous system and is described as a “window to the brain” [7]. Optical coherence tomography (OCT), which is a noninvasive method that allows for objective evaluations of changes in retinal morphology, has been applied to a variety of neurodegenerative diseases, such as Alzheimer’s disease and PD [8], as well as atypical parkinsonism, including PSP. A previous pathological study has shown that individuals with PSP demonstrate an accumulation of hyperphosphorylated tau in the retina [9]. Furthermore, it has been reported that tau pathology can affect the visual system during the disease course and progress along the visual pathways [10]. Therefore, we speculated that patients with PSP would have a distinct pattern of retinal thickness changes that are associated with disease severity.
- The relationship between retinal thickness and intracranial molecular changes has rarely been investigated in PSP. A previous study by Woo et al. [11] using brain magnetic resonance imaging revealed no correlation between peripapillary retinal nerve fiber layer (pRNFL) thickness and brain volume. Nigral dopaminergic loss and regional hypometabolism can be measured by using 11C-2β-carbomethoxy-3β-(4-fluorophenyl) tropane (11C-CFT), which is a marker of the presynaptic dopamine transporter (DAT), and 18F-fluorodeoxyglucose (18F-FDG) positron emission tomography (PET), respectively. Dual-tracer PET has been applied to investigate the pathogenesis, diagnosis, and differential diagnosis of PSP [12-15]. To determine whether a link exists between retinal thinning and intracranial molecular changes, we also applied dual-tracer PET in this study.
- We conducted a cross-sectional study on retinal thickness that was measured by using OCT in PSP patients and healthy controls (HCs) and explored its correlation with clinical features. Due to the high prevalence of photophobia and its negative impact on daily life [6], we also investigated photophobia and its correlation with retinal thickness in our PSP cohort. In addition, we explored the pathophysiological implications of retinal thinning by exploring its correlation with dopaminergic degeneration and cerebral glucose metabolism, as estimated by using 11C-CFT and 18F-FDG PET, respectively.
INTRODUCTION
- Participants
- Nineteen patients with PSP (38 eyes) and 20 HCs (40 eyes) were enrolled between June 2020 and June 2021 from the Second Affiliated Hospital, Zhejiang University School of Medicine. PSP diagnosis was made by two movement disorder specialists based on the International Parkinson and Movement Disorder Society criteria [16]. We recruited HCs who underwent routine exams at the eye clinic and who were similar in age and sex to the patients; additionally, HCs were examined by neurologists to be free of neurological disorders. The exclusion criteria were as follows: 1) the presence of comorbid ophthalmologic conditions capable of affecting retinal thickness, such as diabetic retinopathy, hypertensive retinopathy, age-related macular degeneration, retinal vein or artery occlusion, epiretinal membrane, macular hole, high myopia (defined as a spherical equivalent greater than -6 diopters), or glaucomatous optic neuropathies; and 2) history of neurodegenerative diseases other than PSP, central nervous system autoimmune disease, cerebral stroke, brain trauma, or other structural brain lesions. The Progressive Supranuclear Palsy Rating Scale (PSPRS), Movement Disorder Society-Unified Parkinson’s Disease Rating Scale part III (MDS-UPDRS III), and Hoehn and Yahr (H-Y) scales were administered in the “off” state to assess disease severity. The Mini-Mental State Examination (MMSE) and Montreal Cognitive Assessment (MoCA) were used to assess cognitive function. Patients were asked “Does light cause discomfort in the eye?” to assess whether they had photophobia. Detailed clinical data were collected by two neurologists.
- This study was approved by the Ethics Committee of the Second Affiliated Hospital of Zhejiang University School of Medicine (20210819). Written informed consent was obtained from all of the participants prior to participating in the study.
- Ophthalmologic evaluations and OCT data acquisition
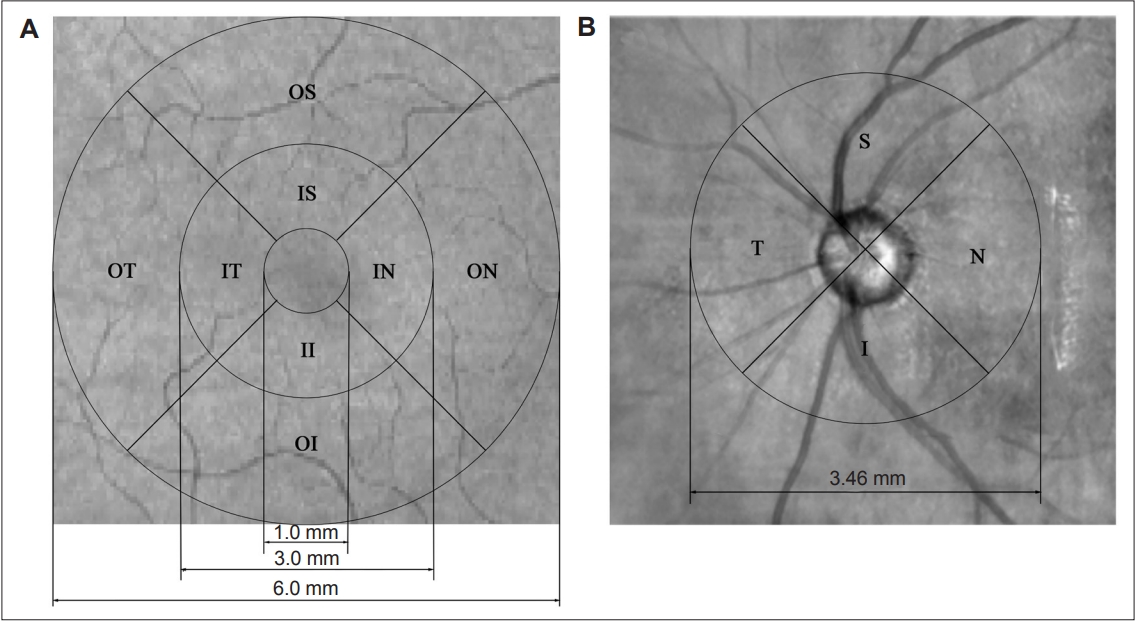
- Subjects underwent comprehensive ophthalmologic examinations, which consisted of best-corrected visual acuity, slit-lamp biomicroscopy, fundus photography, and spectral-domain Cirrus HD-OCT 5000 scanning (Carl Zeiss Meditec, Dublin, CA, USA) with eye-tracking systems. Participants were examined without pupillary dilation. All of the ophthalmologic examinations were completed on the same day. Cross-sectional tomograms of the retina were generated by using OCT imaging. Additionally, images with large eye movements, disconnected large retinal vessels, or black bands (caused by blinking) were rejected throughout the examinations. OCT scanning was completed by two skilled operators, and OCT parameters were automatically calculated by the equipment software (version 9.5.2.19038; Carl Zeiss Meditec, Inc., Dublin, CA, USA). The scan with the best resolution was used for the analysis. The macular protocol involved 128 B-scans, each comprising 512 A-scans. The retinal thickness of the macula was defined as the distance between the pigment epithelium layer and the inner limiting membrane. A circle with a 6-mm diameter was centered around the fovea, with a central 1-mm disc and inner and outer rings of 3 mm and 6 mm, respectively. These rings were divided into four quadrants (except for the central circle), and the thickness of the center, inner superior, inner temporal (IT), inner inferior, inner nasal, outer superior, outer temporal (OT), outer inferior (OI), and outer nasal areas of the macula were measured (Figure 1). The overall average macular thickness covered the entire 6 × 6-m square scanning area. Moreover, the pRNFL protocol consisted of 200 B-scans, each comprising 200 A-scans, which were automatically positioned at the center of the optic disk that covered a 3.46-mm diameter circle. The average thickness and the thicknesses of the superior, temporal, inferior, and nasal areas of the pRNFL were measured (Figure 1). The OCT data displayed in our study followed the Advised Protocol for OCT Study Terminology and Elements (APOSTEL) recommendation [17].
- PET/computed tomography image acquisition
- After a minimum of 6 h of fasting and 12 h of withdrawal of anti-Parkinson medication, all of the subjects were intravenously injected with 7.4 MBq/kg 11C-CFT and 3.7 MBq/kg 18F-FDG on different days within 2 weeks. Three-dimensional PET/computed tomography (CT) brain images were acquired on a PET/CT scanner (Biograph mCT; Siemens Medical Solutions, Mountain View, PE, USA) approximately 40–70 min after the injection. The scan durations were 15 min for 11C-CFT PET and 5 min for 18F-FDG PET. CT data were used for attenuation correction and to provide structural information. The 11C-CFT PET data were reconstructed by using attenuation-weighted orderedsubsets expectation maximization, and the 18F-FDG PET data were reconstructed by using the point spread function. All of the PET data and corresponding CT data were aligned by using the scanner software.
- PET/CT image processing
- PET data processing was conducted by using SPM12 (Wellcome Trust Centre for Neuroimaging, Institute of Neurology, UCL; https://www.fil.ion.ucl.ac.uk/spm), which was implemented in MATLAB R2021a (MathWorks, Inc., Natick, MA, USA; https://ww2.mathworks.cn/products/matlab). Before processing, the 18F-FDG PET/CT and 11C-CFT PET/CT images were manually set to the anterior commissure.
- The 18F-FDG image processing steps were as follows: 1) the 18F-FDG images were normalized to Montreal Neurological Institute (MNI) space by using the SPM12 Normalize module; 2) intensity normalization was applied via global mean division within a predefined gray matter mask with a tissue probability of > 20% (provided by SPM12); 3) the 18F-FDG images were spatially smoothed with a full-width half-maximum of 6 mm; and 4) images were separated into left and right hemispheres.
- The 11C-CFT image processing steps were as follows: 1) the 11C-CFT PET/CT images were coregistered to the 18F-FDG PET/CT images via the CT images; 2) the 11C-CFT images were normalized to MNI space by using the 18F-FDG normalizing matrix; 3) intensity normalization was applied by dividing the mean value of V1 (which was defined by the Automated Anatomical Labeling template); 4) the bilateral caudate, accumbens, anterior putamen, and posterior putamen were selected as regions of interest (ROIs; masks were defined by using the three subregions from the Oxford-Imanova Structural Atlas and the Oxford-Imanova Striatal Connectivity Atlas); and 5) the mean standard uptake value ratio (SUVr) was extracted from each ROI.
- Statistical analysis
- Statistical analysis was performed by using SPSS 25.0 software (IBM Corp., Armonk, NY, USA) and DPABI (The R-fMRI Lab, Institute of Psychology, Chinese Academy of Sciences, Beijing, China; http://rfmri.org/dpabi) implemented in SPM12 [18]. Independent t tests and Pearson’s chi-squared tests were used to compare demographic data between groups. An analysis of covariance was used to compare retinal thickness between patients and HCs, with age, sex, and within-participant intereye correlations as covariates. False discovery rate correction was applied for multiple comparison adjustments, and p < 0.05 was considered to be statistically significant. Indicators of significant retinal thickness thinning were selected for further analysis.
- The relationship between clinical variables and retinal thickness was determined by using a generalized linear model (GLM) (controlling for age and sex), with statistical significance set at p < 0.05. To assess the correlation between clinical variables and retinal thickness, the average thickness of each individual was calculated. We subsequently investigated the correlation between retinal thickness and the PET images by performing a GLM between the SUVr of the 11C-CFT images and retinal thickness, controlling for age, sex, within-participant intereye correlations, and disease duration. Due to the fact that the macula is located temporally to the optic disc, with temporal fibers projecting to the ipsilateral hemisphere (whereas the temporal and nasal fibers join together at the optic disc and project through the optic chiasm to both hemispheres [19]), we compared macular thickness in each eye with the ipsilateral ROIs [20]. For pRNFL thickness, the mean retinal thickness across both eyes was compared with the mean values of the bilateral ROIs. A p < 0.05 was considered to be statistically significant.
- The DPABI Statistical Analysis module was used to investigate significant areas of correlation between 18F-FDG values and retinal thickness, with age, sex, within-participant intereye correlations, and disease duration as covariates. For macular thickness, each eye was compared with the ipsilateral hemisphere image. For pRNFL thickness, the mean value across both eyes was compared with the whole-brain image. R-maps were corrected by using Gaussian random field correction implemented in DPABI (voxel-level p < 0.001, cluster-level p < 0.05, two-tailed).
MATERIALS & METHODS
- Characteristics of participants
- Of the 19 PSP patients who were included, 13 patients had PSP with probable Richardson’s syndrome (PSP-RS), one patient had PSP with possible parkinsonism (PSP-P), one patient had PSP with suggestive PSP-P, two patients had PSP with possible progressive gait freezing (PSP-PGF), one patient had PSP with possible corticobasal syndrome, and one patient had PSP with suggestive predominant postural instability. The demographic, clinical, and neurophysiological information of PSP patients and HCs are shown in Table 1. There were no significant differences in age or sex between the two groups. In the PSP cohort, the disease duration was 3.3 ± 2.2 years, the H-Y stage was 3.0 ± 0.7, the MDS-UPDRS III score was 45.7 ± 15.2, the PSPRS score was 29 ± 12.5, the MMSE score was 23.5 ± 5.7, and the MoCA score was 18.1 ± 6.8. Photophobia was present in eight patients (42.1%).
- Retinal thickness
- The analysis of covariance indicated that compared with HCs, PSP patients had significantly thinner macula on average and in the IT, OT, and OI sectors, as well as significantly thinner pRNFL in the superior sector (Table 2). These areas were selected for further analysis.
- Correlation between retinal thickness and clinical symptoms
- The GLM revealed that the thickness of the superior sector of the pRNFL was negatively correlated with the MDS-UPDRS III score (p = 0.008, t = -3.19) and H-Y stage (p = 0.008, t = -3.22) (Table 3). The macular thickness of the OI sector was negatively correlated with disease duration (p = 0.044, t = -2.21) (Table 3). The OT sector of the macula was positively correlated with the MoCA score (p = 0.017, t = 2.72) (Table 3). An independent t test showed no significant difference in retinal thickness between patients with and without photophobia.
- Correlation between retinal thickness and 11C-CFT PET
- The partial correlation analysis indicated that in PSP patients, the thickness of the OT macula was positively correlated with the 11C-CFT values in the caudate (p = 0.005, t = 3.04) (Table 3).
- Correlation between retinal thickness and 18F-FDG PET
- The correlation analysis demonstrated positive correlations between average macular thickness and 18F-FDG values in the cerebellum Crus I and parietal region (Supplementary Figure 1A in the online-only Data Supplement). The thickness of the OT macula was positively correlated with the 18F-FDG values in the cerebellum Crus I (Supplementary Figure 1B in the online-only Data Supplement). The thickness of the OI macula was positively correlated with the 18F-FDG values in the cerebellum Crus I (Supplementary Figure 1C in the online-only Data Supplement). No significant associations were found between the retinal thickness of the pRNFL and 18F-FDG values.
RESULTS
- We measured the thickness of all of the sectors of the macula and the pRNFL, which were automatically divided by using OCT. We demonstrated that the macula and the pRNFL of the retina were significantly thinner in PSP patients than in HCs and were negatively correlated with motor symptoms and disease duration. These findings suggest that retinal thickness is closely linked to disease severity in PSP patients. We also explored correlations between macular thickness and MoCA scores, which indicated the existence of a mutual association between retinal thinning and cognitive impairment. Moreover, we further explored correlations between retinal thinning and decreased DAT binding in the caudate and identified possible pathophysiological interconnections between the retina and nigrostriatal dopaminergic cell degeneration.
- Distinct retinal thinning patterns in PSP
- We analyzed several sectors of the pRNFL and observed significant thinning of the superior pRNFL and decreased thickness of the inferior pRNFL in patients compared with HCs. Most previous studies have reported of significant thinning in the superior pRNFL in patients with PSP [11,21,22]; moreover, Stemplewitz et al. [22] reported of inferior pRNFL thinning. These results indicate that magnocellular cells (M-cells) are preferentially affected in PSP patients. The axons of M-cells converge at the superior, inferior, and nasal optic disks and are associated with achromatic vision, motion detection, and contrast sensitivity to low spatial frequency [23]. In contrast, PD patients exhibit a preferential loss of parvocellular cells, the axons of which are arranged temporally in the optic disk [24]. Thus, the different retinal involvement patterns may be valuable for the differential diagnosis of PSP and PD. In addition, we observed overall average macular thickness thinning in PSP patients, which is consistent with the results of a recent meta-analysis [25]. Furthermore, we observed significantly lower thickness in the IT, OT, and OI sectors of the macula in PSP patients than in HCs, whereas previous studies have reported a significantly thinner macula across most sectors in PSP patients than in HCs [22,26]. The small sample size, the variabilities in disease duration, severity, patient subtypes, scanning protocols, and the varied acquisition parameters for the divided sectors may account for such discrepancies. Longitudinal multicenter studies in larger patient cohorts using consistent methodology are needed to further clarify the specific patterns of retinal thinning in patients with PSP.
- Correlation between retinal thickness and clinical symptoms
- We demonstrated that OI macular thickness was negatively correlated with disease duration. Although several studies have found no correlation between retinal thickness and disease duration [22,27], our results are consistent with the findings of Gulmez Sevim et al. [21], wherein the severity of macular thickness thinning in PSP patients was associated with disease duration. We also found that the superior sector of the pRNFL was negatively correlated with the MDS-UPDRS III score and H-Y stage. However, similar to a previous study [22], we did not observe a significant correlation between retinal thickness and PSPRS score [28], which may be because the PSPRS emphasizes behavioral changes and ocular motor deficits, whereas the MDS-UPDRS III provides a more detailed and comprehensive evaluation of motor symptoms. Our findings suggest that retinal thinning can be used as a candidate marker for monitoring disease severity in patients with PSP.
- Furthermore, we found a significant positive association between OT macular thickness and MoCA score. Similarly, a recent study reported of a correlation between visual spatial abilities and retinal layers in PSP [29]. Visual stimulation is the primary input for most standard neuropsychological tests, and the retina is the first processing site involved in the analysis and interpretation of visual information. Basic computations for image analysis and interpretation, such as edge detection, are performed in the retina. Injury to the retina may disrupt the transmission of visual information along the visual pathway, which may subsequently adversely impact cognitive functions. However, despite this association, the mechanisms underlying the relationship between cognitive decline and retinal thinning remain to be further studied in PSP patients. Notably, we found no correlation between retinal thickness and MMSE scores. This lack of correlation may be attributed to the higher sensitivity of the MoCA than the MMSE in detecting cognitive impairments in PSP patients, particularly in the evaluation of visuospatial and executive domains [30]. This finding suggests the existence of an association between retinal thinning and cognitive impairment.
- Recently, photophobia has attracted increasing attention and is considered a frequent symptom of PSP that significantly negatively affects daily activities [6]. We found that 42.1% of our PSP patients had photophobia, which is slightly lower than the prevalence of 43%–100% reported in previous studies [1,6,31]. To date, the pathophysiology of photophobia in PSP patients has not been elucidated. IpRGCs, which are a type of photoreceptor that contains the melanopsin photopigment, have been identified as being important cells in the pathophysiological mechanism of photophobia in the retina [5]. The thickness of the pRNFL, which encompasses the axons of ipRGCs, has been shown to positively correlate with ipRGC activity [32]. However, we did not observe a significant difference in pRNFL thickness between patients with and without photophobia. This suggests that photophobia in PSP is not caused by the involvement of ipRGCs in the retina and that other pathogenic mechanisms are likely involved, such as the Edinger-Westphal nucleus, which is located in the midbrain and controls the pupillary light reflex [33]. However, further studies with a larger sample size are needed to confirm this result.
- Correlation between retinal thickness and uptake of 11C-CFT and 18F-FDG
- Our examination of the relationship between retinal thinning and brain degeneration (as assessed by 11C-CFT) in PSP patients revealed a significant positive correlation between retinal thinning in the OT sector of the macula and DAT loss in the caudate, which indicated that PSP patients with a thinner retina had greater DAT loss in the caudate. Previous DAT-PET studies have shown more profound DAT binding impairment in the caudate in PSP patients than in patients with other types of degenerative parkinsonism, such as PD and multiple system atrophy [12,34,35]. The involvement of the caudate, which is projected by A9 dopamine neurons of the midbrain, may (to some extent) reflect the extensive pathological changes in the midbrain that have been reported in postmortem studies [36,37]. Basal ganglia DAT loss reflects presynaptic degeneration of dopaminergic neurons and may also be associated with the accumulation of pathogenic tau in the nigrostriatal system of PSP patients. Although few studies on retinal pathology have been conducted in patients with PSP, the accumulation of hyperphosphorylated tau in the retina has been described in two patients with PSP [9]. Therefore, we speculate that tau accumulation in the retina may occur in parallel with the accumulation of tau in the brain, and this observation may explain why PSP patients with thinner retinas tend to have more severe parkinsonism. Our exploratory study identified pathophysiological interconnections between retinal changes and nigrostriatal dopaminergic cell degeneration. Our findings provide a basis for further follow-up clinical research into the application of OCT in patients with PSP.
- In addition, we observed a significant positive correlation between retinal thickness and 18F-FDG values in the cerebellum Crus I. However, cerebellum Crus I is not included in the PSP-related metabolic abnormality pattern that has been identified in FDG-PET studies [38]. The significance of this correlation remains unclear and highlights the need for further investigations.
- Limitations
- There were several limitations to our study. First, the diagnosis of PSP was based on clinical diagnostic criteria rather than pathological confirmation. Second, the sample size was relatively small; thus, we were unable to analyze PSP subtypes. Large cohort studies of PSP are needed to confirm our results and further explore retinal thickness between PSP subtypes. Third, this was a cross-sectional study. Therefore, the correlations between retinal structural changes and motor severity and intracranial neuronal changes need to be confirmed by using longitudinal follow-up studies. Fourth, we did not further segment the whole retinal layer to explore the segmented layers of the retina in PSP. However, our study demonstrated the correlation between overall layer thickness and disease severity, which provided a basis for future investigations into the role of segmented layers in PSP. Finally, the clinical utility of currently available tau tracers for 4R tauopathies is controversial [39]. However, tau PET imaging is a promising method for investigating the role of tau pathology in patients with PSP. Further studies are needed to evaluate the utility of tau PET imaging in PSP for investigating the pathological connection between the retina and the brain.
- Conclusion
- We demonstrated a distinct retinal thinning pattern in patients with PSP. Specifically, thinning was observed in the superior pRNFL and the average and IT, OT, and OI sectors of the macula. The negative correlation between retinal thinning and motor symptoms and disease duration suggested that retinal thinning could be a candidate marker for monitoring disease severity. Furthermore, 11C-CFT PET in patients with PSP showed that macular thinning was closely linked to nigrostriatal dopaminergic cell degeneration, which indicated that macular thinning could be an in vivo indicator of intracranial alterations in PSP patients. Further research and validation studies are warranted to confirm these findings.
DISCUSSION
Supplementary Material
Supplementary Figure 1.
-
Conflicts of Interest
The authors have no financial conflicts of interest.
-
Funding Statement
This study was supported by the Science Technology Department of Zhejiang Province (2019C03017) and the Medical and Health Research Program of Zhejiang Province (2022RC164).
-
Author contributions
Conceptualization: Wei Luo, Yueting Chen, Bo Wang. Data curation: Yueting Chen, Haotian Wang, Bo Wang, Peng Liu, Xinhui Chen, Zhidong Cen, Zhiyuan Ouyang, Sheng Wu, Wenbo Li, Panpan Ye, Wen Xu, Xiaofeng Dou. Formal analysis: Haotian Wang, Xinhui Chen. Funding acquisition: Wei Luo, Hong Zhang, Mei Tian. Investigation: Yueting Chen, Bo Wang, Haotian Wang. Methodology: Haotian Wang, Xinhui Chen, Bo Wang. Project administration: Wei Luo, Hong Zhang, Mei Tian. Supervision: Wei Luo, Hong Zhang, Mei Tian. Validation: Yi Liao. Writing-original draft: Yueting Chen, Bo Wang, Haotian Wang. Writing-review & editing: Wei Luo, Hong Zhang, Mei Tian, Wenbo Li, Panpan Ye, Wen Xu, Xinhui Chen, Zhidong Cen, Zhiyuan Ouyang, Sheng Wu.
Notes
- The authors thank the patients for their participation in the project.
Acknowledgments

Values are presented as mean ± standard deviation unless otherwise indicated.
PSP, progressive supranuclear palsy; HCs, healthy controls; OCT, optical coherence tomography; pRNFL, peripapillary retinal nerve fiber layer; MDS-UPDRS III, Movement Disorder Society-Unified Parkinson’s Disease Rating Scale part III; H-Y, Hoehn and Yahr; PSPRS, Progressive Supranuclear Palsy Rating Scale; MMSE, Mini-mental State Examination; MoCA, Montreal Cognitive Assessment.
| Location | PSP | HCs | Unadjusted p value | Adjusted p value |
|---|---|---|---|---|
| Macula | ||||
| Average | 268.0 ± 15.6 | 280.3 ± 11.2 | 0.00042 | 0.0032* |
| Center | 241.6 ± 31.2 | 245.4 ± 22.6 | 0.51 | 0.59 |
| IS | 311.6 ± 15.8 | 319.7 ± 16.0 | 0.19 | 0.35 |
| IT | 298.6 ± 13.1 | 306.2 ± 17.8 | 0.0080 | 0.030* |
| II | 299.3 ± 49.0 | 314.4 ± 16.9 | 0.048 | 0.12 |
| IN | 312.9 ± 14.3 | 318.0 ± 17.9 | 0.23 | 0.35 |
| OS | 276.5 ± 19.6 | 280.7 ± 12.3 | 0.35 | 0.48 |
| OT | 257.0 ± 14.3 | 265.8 ± 10.6 | 0.00027 | 0.0032* |
| OI | 260.6 ± 15.1 | 272.1 ± 16.7 | 0.0015 | 0.045* |
| ON | 290.4 ± 20.3 | 295.6 ± 15.0 | 0.80 | 0.80 |
| Optic disk | ||||
| Average | 95.8 ± 8.4 | 101.4 ± 8.2 | 0.084 | 0.18 |
| Superior | 109.7 ± 22.2 | 124.1 ± 13.0 | 0.0028 | 0.014* |
| Temporal | 75.2 ± 16.4 | 75.8 ± 13.4 | 0.44 | 0.55 |
| Inferior | 123.2 ± 18.2 | 130.4 ± 13.7 | 0.23 | 0.35 |
| Nasal | 75.3 ± 15.2 | 75.4 ± 12.1 | 0.80 | 0.80 |
Values are presented as mean ± standard deviation unless otherwise indicated.
* false discovery rate adjusted p < 0.05.
PSP, progressive supranuclear palsy; HCs, healthy controls; IS, inner superior; IT, inner temporal; II, inner inferior; IN, inner nasal; OS, outer superior; OT, outer temporal; OI, outer inferior; ON, outer nasal.

- 1. Nath U, Ben-Shlomo Y, Thomson RG, Lees AJ, Burn DJ. Clinical features and natural history of progressive supranuclear palsy: a clinical cohort study. Neurology 2003;60:910–916.ArticlePubMed
- 2. Pula JH, Kim J, Nichols J. Visual aspects of neurologic protein misfolding disorders. Curr Opin Ophthalmol 2009;20:482–489.ArticlePubMed
- 3. Bak TH, Caine D, Hearn VC, Hodges JR. Visuospatial functions in atypical parkinsonian syndromes. J Neurol Neurosurg Psychiatry 2006;77:454–456.ArticlePubMedPMC
- 4. Wang L, Kuroiwa Y, Kamitani T, Li M, Takahashi T, Suzuki Y, et al. Visual event-related potentials in progressive supranuclear palsy, corticobasal degeneration, striatonigral degeneration, and Parkinson’s disease. J Neurol 2000;247:356–363.ArticlePubMedPDF
- 5. Wu Y, Hallett M. Photophobia in neurologic disorders. Transl Neurodegener 2017;6:26.ArticlePubMedPMCPDF
- 6. Mohanty D, Hay KR, Berkowitz S, Patel S, Lin YC, Kang H, et al. Clinical implications of photophobia in progressive supranuclear palsy. Clin Park Relat Disord 2021;4:100097.ArticlePubMedPMC
- 7. London A, Benhar I, Schwartz M. The retina as a window to the brain-from eye research to CNS disorders. Nat Rev Neurol 2013;9:44–53.ArticlePubMedPDF
- 8. Mancino R, Cesareo M, Martucci A, Di Carlo E, Ciuffoletti E, Giannini C, et al. Neurodegenerative process linking the eye and the brain. Curr Med Chem 2019;26:3754–3763.ArticlePubMed
- 9. Schön C, Hoffmann NA, Ochs SM, Burgold S, Filser S, Steinbach S, et al. Long-term in vivo imaging of fibrillar tau in the retina of P301S transgenic mice. PLoS One 2012;7:e53547.ArticlePubMedPMC
- 10. Rahimi J, Milenkovic I, Kovacs GG. Patterns of tau and α-synuclein pathology in the visual system. J Parkinsons Dis 2015;5:333–340.ArticlePubMed
- 11. Woo KA, Shin JY, Kim H, Ahn J, Jeon B, Lee JY. Peripapillary retinal nerve fiber layer thinning in patients with progressive supranuclear palsy. J Neurol 2022;269:3216–3225.ArticlePubMedPMCPDF
- 12. Kaasinen V, Kankare T, Joutsa J, Vahlberg T. Presynaptic striatal dopaminergic function in atypical parkinsonism: a metaanalysis of imaging studies. J Nucl Med 2019;60:1757–1763.ArticlePubMedPMC
- 13. Yoo HS, Chung SJ, Kim SJ, Oh JS, Kim JS, Ye BS, et al. The role of 18F-FPCIT PET in differentiation of progressive supranuclear palsy and frontotemporal dementia in the early stage. Eur J Nucl Med Mol Imaging 2018;45:1585–1595.ArticlePubMedPDF
- 14. Meyer PT, Frings L, Rücker G, Hellwig S. 18F-FDG PET in parkinsonism: differential diagnosis and evaluation of cognitive impairment. J Nucl Med 2017;58:1888–1898.ArticlePubMed
- 15. Smith R, Schöll M, Honer M, Nilsson CF, Englund E, Hansson O. Tau neuropathology correlates with FDG-PET, but not AV-1451-PET, in progressive supranuclear palsy. Acta Neuropathol 2017;133:149–151.ArticlePubMedPMCPDF
- 16. Höglinger GU, Respondek G, Stamelou M, Kurz C, Josephs KA, Lang AE, et al. Clinical diagnosis of progressive supranuclear palsy: the movement disorder society criteria. Mov Disord 2017;32:853–864.ArticlePubMedPMCPDF
- 17. Aytulun A, Cruz-Herranz A, Aktas O, Balcer LJ, Balk L, Barboni P, et al. APOSTEL 2.0 recommendations for reporting quantitative optical coherence tomography studies. Neurology 2021;97:68–79.ArticlePubMedPMC
- 18. Yan CG, Wang XD, Zuo XN, Zang YF. DPABI: data processing & analysis for (resting-state) brain imaging. Neuroinformatics 2016;14:339–351.ArticlePubMedPDF
- 19. Gupta M, Ireland AC, Bordoni B. Neuroanatomy, visual pathway [Internet]. Treasure Island: StatPearls Publishing, 2023. [accessed on 2023 August 10]. Available at: https://www.ncbi.nlm.nih.gov/books/NBK553189/.
- 20. Ahn J, Lee JY, Kim TW, Yoon EJ, Oh S, Kim YK, et al. Retinal thinning associates with nigral dopaminergic loss in de novo Parkinson disease. Neurology 2018;91:e1003–e1012.ArticlePubMed
- 21. Gulmez Sevim D, Unlu M, Gultekin M, Karaca C, Mirza M, Mirza GE. Evaluation of retinal changes in progressive supranuclear palsy and Parkinson disease. J Neuroophthalmol 2018;38:151–155.ArticlePubMed
- 22. Stemplewitz B, Kromer R, Vettorazzi E, Hidding U, Frings A, Buhmann C. Retinal degeneration in progressive supranuclear palsy measured by optical coherence tomography and scanning laser polarimetry. Sci Rep 2017;7:5357.ArticlePubMedPMCPDF
- 23. Silveira LC, Saito CA, Lee BB, Kremers J, da Silva Filho M, Kilavik BE, et al. Morphology and physiology of primate M- and P-cells. Prog Brain Res 2004;144:21–46.ArticlePubMed
- 24. La Morgia C, Di Vito L, Carelli V, Carbonelli M. Patterns of retinal ganglion cell damage in neurodegenerative disorders: parvocellular vs magnocellular degeneration in optical coherence tomography studies. Front Neurol 2017;8:710.PubMedPMC
- 25. Ma X, Wang Y, Wang N, Zhang R. Retina thickness in atypical parkinsonism: a systematic review and meta-analysis. J Neurol 2022;269:1272–1281.ArticlePubMedPDF
- 26. Albrecht P, Müller AK, Südmeyer M, Ferrea S, Ringelstein M, Cohn E, et al. Optical coherence tomography in parkinsonian syndromes. PLoS One 2012;7:e34891.ArticlePubMedPMC
- 27. Alkabie S, Lange A, Manogaran P, Stoessl AJ, Costello F, Barton JJS. Optical coherence tomography of patients with Parkinson’s disease and progressive supranuclear palsy. Clin Neurol Neurosurg 2020;189:105635.ArticlePubMed
- 28. Golbe LI, Ohman-Strickland PA. A clinical rating scale for progressive supranuclear palsy. Brain 2007;130(Pt 6):1552–1565.ArticlePubMed
- 29. Picillo M, Salerno G, Tepedino MF, Abate F, Cuoco S, Gioia M, et al. Retinal thinning in progressive supranuclear palsy: differences with healthy controls and correlation with clinical variables. Neurol Sci 2022;43:4803–4809.ArticlePubMedPMCPDF
- 30. Fiorenzato E, Weis L, Falup-Pecurariu C, Diaconu S, Siri C, Reali E, et al. Montreal cognitive assessment (MoCA) and mini-mental state examination (MMSE) performance in progressive supranuclear palsy and multiple system atrophy. J Neural Transm (Vienna) 2016;123:1435–1442.ArticlePubMedPDF
- 31. Cooper AD, Josephs KA. Photophobia, visual hallucinations, and REM sleep behavior disorder in progressive supranuclear palsy and corticobasal degeneration: a prospective study. Parkinsonism Relat Disord 2009;15:59–61.ArticlePubMed
- 32. Gracitelli CP, Duque-Chica GL, Moura AL, Nagy BV, de Melo GR, Roizenblatt M, et al. A positive association between intrinsically photosensitive retinal ganglion cells and retinal nerve fiber layer thinning in glaucoma. Invest Ophthalmol Vis Sci 2014;55:7997–8005.ArticlePubMed
- 33. Noseda R, Copenhagen D, Burstein R. Current understanding of photophobia, visual networks and headaches. Cephalalgia 2019;39:1623–1634.ArticlePubMedPMCPDF
- 34. Pirker W, Asenbaum S, Bencsits G, Prayer D, Gerschlager W, Deecke L, et al. [123I]β-CIT SPECT in multiple system atrophy, progressive supranuclear palsy, and corticobasal degeneration. Mov Disord 2000;15:1158–1167.ArticlePubMed
- 35. Oh M, Kim JS, Kim JY, Shin KH, Park SH, Kim HO, et al. Subregional patterns of preferential striatal dopamine transporter loss differ in Parkinson disease, progressive supranuclear palsy, and multiple-system atrophy. J Nucl Med 2012;53:399–406.ArticlePubMed
- 36. Murphy KE, Karaconji T, Hardman CD, Halliday GM. Excessive dopamine neuron loss in progressive supranuclear palsy. Mov Disord 2008;23:607–610.ArticlePubMed
- 37. Hardman CD, Halliday GM, McRitchie DA, Cartwright HR, Morris JG. Progressive supranuclear palsy affects both the substantia nigra pars compacta and reticulata. Exp Neurol 1997;144:183–192.ArticlePubMed
- 38. Martí-Andrés G, van Bommel L, Meles SK, Riverol M, Valentí R, Kogan RV, et al. Multicenter validation of metabolic abnormalities related to PSP according to the MDS-PSP criteria. Mov Disord 2020;35:2009–2018.PubMed
- 39. Leuzy A, Chiotis K, Lemoine L, Gillberg PG, Almkvist O, RodriguezVieitez E, et al. Tau PET imaging in neurodegenerative tauopathies-still a challenge. Mol Psychiatry 2019;24:1112–1134.ArticlePubMedPMCPDF
REFERENCES
Figure & Data
References
Citations
- Optical Coherence Tomography as a Biomarker in the Differential Diagnosis between Parkinson’s Disease and Atypical Parkinsonian Syndromes: A Narrative Review
Stella Karatzetzou, Dimitrios Parisis, Serafeim Ioannidis, Theodora Afrantou, Panagiotis Ioannidis
Applied Sciences.2024; 14(6): 2491. CrossRef
Comments on this article
 PubReader
 ePub Link
 Cite
Cite