Premonitory Urges Reconsidered: Urge Location Corresponds to Tic Location in Patients With Primary Tic Disorders
Article information

Abstract
Objective
In patients with Tourette syndrome and other primary tic disorders (PTDs), tics are typically preceded by premonitory urges (PUs). To date, only a few studies have investigated the location and frequency of PUs, and contrary to clinical experience, the results suggest that PUs are not located in the same anatomic region as the tics. This study aimed to further explore PU location and frequency in detail, differentiating the kind and complexity of the corresponding tics, in a large sample of patients with PTD.
Methods
A total of 291 adult (≥ 18 years) patients with a confirmed diagnosis of chronic PTD were included. The study was conducted online, assement included tics and the general characterization of PUs and a sophisticated body drawing for locating PUs.
Results
We found that PUs were located in the same body area as, or in direct proximity to, the corresponding tic. Most frequently, PUs were located in the face and at the head (62.1%). Compared with simple tics, complex (motor and vocal) tics were more often preceded by a PU; but there was no difference in PU frequency observed between motor tics and vocal tics. PUs were more often experienced at the front than at the back of the body (73% vs. 27%), while there was no difference between the right and left sides (41.6% vs. 41.3%).
Conclusion
The strong association between PU and tic location further supports the hypothesis that PUs represent the core of PTD. Accordingly, future therapies should focus on treating PUs to achieve greater tic reduction.
Tourette syndrome (TS) and other primary tic disorders are characterized as childhood onset chronic neuropsychiatric disorders that present with motor and/or vocal tics. Most patients also suffer from psychiatric comorbidities, including attention deficit/hyperactivity disorder (ADHD), obsessive-compulsive disorder (OCD), anxiety, and depression [1,2]. Preceding sensory or premonitory urges (PUs) have been identified as a typical characteristic of tics and are reported by 37% to 100% of patients [2-10], with a clear age dependency [2-4,8,10-12].
In their landmark paper in 1993, Leckman et al. [10] were the first to investigate PU locations in more detail (n = 135, age range = 8–71 years) by using a full body scheme (printed image) onto which patients could mark the PU locations of their “eight most common motor and phonic tics.” [10] Head/neck and shoulder tics were reported to be those tics most likely preceded by a PU. Thereafter, only a limited number of studies on PU locations—all including only small sample sizes—were conducted. However, none of these studies examined the relation between PU and tic locations [5-7,13].
The primary goal of this study was to replicate Leckman et al.’s [10] study in a larger and more homogenous sample of adult patients with TS or another chronic tic disorder. By using a sophisticated online survey, we also investigated the following: 1) whether PUs and tics co-occur in the same body regions, 2) the relationship between PUs and their corresponding tics, and 3) whether PUs depend on specific characteristics of tics. In line with the assumption that there is a corresponding tic for each PU [14] (the two are pathophysiologically linked via the insula [15]) we hypothesized that PUs and their corresponding tics are located in the same body regions.
MATERIALS & METHODS
After we received approval from the Hannover Medical School ethics committee (no. 7,631), patients were recruited via Hannover Medical School Tourette outpatient clinic, cooperating study centers (Uniklinik RWTH Aachen, University Hospital Carl Gustav Carus Dresden [UKD], Ludwig Maximilian University of Munich, and University Hospital of Schleswig-Holstein, Campus Lübeck), and German Tourette advocacy groups (Tourette-Gesellschaft Deutschland e.V and the InteressenVerband Tic & Tourette Syndrom–IVTS e. V.) between 11/2017 and 3/2018. Participants received an expense allowance. The inclusion criteria were age ≥ 18 years, knowledge of the German language, internet access, and confirmed diagnosis of TS, a chronic motor or vocal tic disorder, or another chronic tic disorder according to the International Statistical Classification of Diseases and Related Health Problems (ICD-10). All participants were asked to provide their age (to maintain anonymity clustered in age groups), sex, level of education, existing psychiatric diagnoses, and current medication for tics and comorbidities, as well as to indicate by whom their diagnosis was made. This study was conducted online using the SoSci Survey platform [16]. Hence, only self-assessments were used.
Tic assessment
To capture a broad spectrum of simple and complex motor and vocal tics, we used a tic checklist that included 56 tics consisting of 14 motor and 9 vocal tics taken from the Adult Tic Questionnaire (ATQ) [17 15], motor and 6 vocal tics from the Yale Global Tic Severity Scale [18], and an additional 7 motor and 5 vocal tics based on clinical experience [19]. For each tic, intensity and frequency were measured following the format used in the ATQ (range, 1–4).
General characterization of PU
PUs were defined as follows: “A PU is a feeling that immediately precedes the tic often described as tingling, feeling of tension, or pressure, e.g., a foreign body sensation at the eye or a scratching or tickling sensation in the throat. However, not all persons perceive PUs, and a person may perceive a PU before some, but not all, tics.” First, participants were asked the following questions about their PUs: 1) Do you typically experience PUs prior to your tics? 2) Are the PUs distributed symmetrically across your body? If not, which side of the body (left vs. right, front vs. back) is more affected? and 3) Did your PUs increase, decrease or remained unchanged over the course of your illness?
Assessment of tic-specific PUs
Thereafter, participants were asked to indicate for each of their current tics if this tic is typically preceded by a PU. If yes (“always” or “sometimes”), participants were asked to mark the exact location of the PU for each individual tic on a body image (adopted from Leckman et al.’s [10] image including 95 different body regions) by using a cursor. Furthermore, participants were asked to indicate whether the performance of the tic resulted in a momentary sense of relief. In addition, we collected data regarding the perception, consistency, intensity, existence, and lateralization of PUs.
Assessment of psychiatric comorbidities
The following self-assessments were used to assess comorbidities and quality of life: 1) the ADHD self-assessment scale [20]; 2) the Beck Anxiety Inventory [21]; 3) the Beck’s Depression Inventory [22]; 4) the Obsessive-Compulsive Inventory-Revised [23]; 5) the Gilles de la Tourette Syndrome–Quality of Life Scale (GTS-QOL) [24]; and 6) a visual analog version of the GTS-QOL [24].
Statistical evaluation
Data were evaluated descriptively (percentages, means, ranges) using SPSS software (v24, IBM Corp., Armonk, NY, USA). The chi-square test was used to evaluate sex differences in PU experience.
RESULTS
Demographic and clinical characteristics
Of the 308 participants completing the online survey, 17 had to be excluded for different reasons (e.g., no or no confirmed diagnosis of a chronic tic disorder, inconsistent answers). Thus, 291 participants (median age group = 26–35 years, male: n = 221 [75.9%], female: n = 70 [24.1%]) were included: 72.9% (n = 212) with a confirmed diagnosis of TS, 23% (n = 67) with chronic motor or vocal tic disorder, and 4.1% (n = 12) with another chronic tic disorder. For reasons of simplicity, we will refer to all participants by using the acronym “primary tic disorder (PTD)” unless otherwise specified. Patient characteristics are shown in Table 1.

Demographic and clinical characteristics (n = 291)
General characterization of PU
In general, 75.9% (n = 221) of the participants indicated that they experienced PUs. However, when asked more specifically about each individual tic, 79.7% (n = 232) of the participants affirmed experiencing PUs. Females were much more likely than males to experience PUs (98.6% [n = 69] vs. 73.8% [n = 163], p < 0.05). Most participants (77.4%, n = 171/221) reported a symmetrical distribution on both sides of the body, while only 13.6% (n = 30) felt PUs more on the right side, and 9% (n = 20) felt them more on the left side. Similarly, three-quarters of the patients (74.9%, n = 218) reported a symmetric distribution of their tics, while only 12.7% (n = 37) reported having more tics on the right side, and 12.4% (n = 36) reported having more tics on the left side. While 52% (n = 115/221) of participants felt no change regarding their PUs during the course of the disease, 28.5% (n = 63) reported an overall increase, and 19.5% (n = 43) reported a decrease over time.
Assessment of tic-specific PUs
Momentary relief
When looking at the tic-specific PU data, 97% (n = 224/232) of those participants reporting tic-specific PUs indicated that they felt for at least one of their tics a momentary relief of the PU after performing the tic. This was reported slightly more often after the performance of motor tics (87.5%, based on a total of n = 2,168 motor tics in n = 224 participants) than after the performance of vocal tics (82.4%, based on a total of n = 830 vocal tics in n = 224 participants); but there was no such difference reported between simple and complex tics (86.1%, based on a total of n = 2,018 simple tics, versus 86.1%, based on a total of n = 980 complex tics in n = 224 participants, with combined data given for motor and vocal tics).
General location of PUs
When simply asked about their beliefs regarding the general location of PUs, 92.2% (n = 214/232) of the participants stated that they felt a PU for at least one of their tics in the same anatomic location as where the tic actually occurs. However, there was a clear difference between simple versus complex and motor versus vocal tics. For 66.4% of simple tics (based on a total of n = 2,018 simple tics in n = 214 participants) but only 56.4% of complex tics (based on a total of n = 980 complex tics in n = 214 participants), PUs were reported in the same location as the tic. An even more apparent difference was observed in the comparison of motor tics to vocal tics (combined simple and complex tics): for 68.3% of motor tics (based on a total of n = 2,168 motor tics in n = 214 participants), but only 49.8% of vocal tics (based on a total of n = 830 vocal tics in n = 214 participants), PUs were reported in the same location as the tics or—in case of vocal tics—an associated location.
In contrast, only 47% (n = 109) of the participants reported a PU for at least one of their tics in a circumscribed location not associated with the location of the tic but at a distinct part of the body. Finally, 52.6% (n = 122) of the participants were unable to anatomically locate a PU (diffuse, noncircumscribed PUs) for at least one of their tics, and 3.9% (n = 9) felt that the PU for at least one of their tics was located “outside the body.” Again, the descriptions strongly depended on the type of tic. A diffuse, noncircumscribed PU location was more frequently reported for complex tics (27.2%, based on a total of n = 980 complex [motor and vocal] tics in n = 122 participants) than for simple tics (19.7%, based on a total of n = 2,018 simple [motor and vocal] tics in n = 122 participants) and more frequently reported for vocal tics (28.3%, based on n = 830 vocal [simple and complex] tics in n = 122 participants) than for motor tics (19.8% based on n = 2,168 motor [simple and complex] tics in n = 122 participants).
PU density
Based on our study design, we received detailed data regarding the anatomical PU locations. For further analyses, we clustered the 95 different body regions as given in the digital body image adopted from Leckman et al. [10] into the following 19 more functionally grouped body areas: 1) forehead, 2) back of the head, 3) eyes, 4) ears, 5) cheeks, 6) nose, 7) mouth, 8) chin, 9) throat, 10) neck, 11) shoulders, 12) arms, 13) hands, 14) chest, 15) abdomen, 16) pelvis, 17) back, 18) legs, and 19) feet.
Based on these 19 body areas, we calculated a PU density (in percent), indicating how often a particular body area was selected from the total number of all body areas: number of marks per body area for all tics (independent of tic location) in all participants divided by the number of marks in all body areas for all tics in all participants (for example: the forehead was marked 573 times, and in total, 4,916 marks were made by 232 participants, resulting in a PU density at the forehead of 11.7% [573/4,916]). The highest PU densities were found (in descending order) in the forehead, cheeks, mouth, throat, and chest (Figure 1, Supplementary Table 1 [in the online-only Data Supplement]). The additional indication of a “diffuse” PU location had no influence on these results.
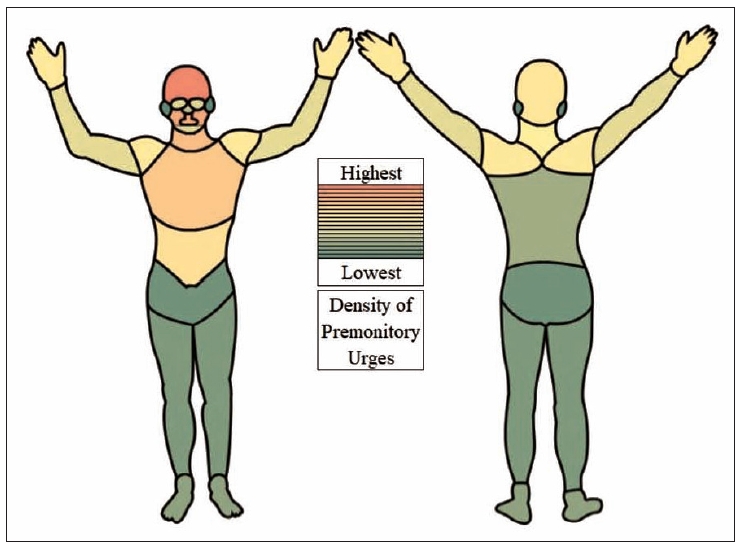
Density of premonitory urges (PU) for all tics (n = 232 participants). The 95 originally identified body regions were combined into 19 body areas. The calculation of PU density for these 19 body areas was based on the number of marks per body area for all tics in all participants divided by the number of marks for all body areas for all tics in all participants. Hence, PU density reflects how often one body area was marked compared to all body areas. Each body area was counted only once per participant per tic, even if the participant marked it several times. The density ranges from a maximum of 11.7% at the forehead to a minimum of 1.4% at the ears.
To compare PU density on the front versus the back of the body, we selected those body areas at the head and trunk, where a meaningful comparison was possible. For these body areas, PUs were more frequently reported on the front: forehead vs. back of the head (11.7% [n = 573] vs. 5.3% [n = 263]), throat vs. the back of the neck (8% [n = 392] vs. 4.7% [n = 229]), and chest and abdomen vs. back (7.3% [n = 360] and 5.6% [n = 276] vs. 3.1% [n = 154]). No major differences were noted between PUs reported on the left and right sides (Supplementary Table 2 in the online-only Data Supplement).
As illustrated in Supplementary Table 1 (in the online-only Data Supplement), no relevant differences in PU densities were seen in the whole sample (n = 232) compared to PU densities observed in participants with a confirmed specific diagnosis of TS (n = 212).
Specific PU location
To analyze tic-specific PU locations to the best extent possible, three different approaches were used based on 1) all motor and vocal tics, 2) those five most common motor and three most common vocal tics as reported in this study, and 3) those five most common motor and three most common vocal tics as selected by Leckman et al. [10].
1) To compare the location of each of the motor and vocal tics in relation to a specific PU location, we assigned all motor tics (excluding copropraxia, echopraxia, turning around, and self-injurious tics, since no clear assignment was possible) to the following six body parts: eyes, face/head, shoulders, arms/hands, trunk, and legs/feet. For motor tics, PU density—indicating how often a specific body part was selected compared to the total number of selections for all body parts—was highest at the face/head followed by (in descending order) the trunk, arms/hands, shoulders, eyes, and legs/feet. Interestingly, for the body parts trunk and shoulders, we found higher PU densities compared to tic densities (Figure 2).

Density of all motor tics and preceding premonitory urges (PU) by body part. Motor tics were assigned to six meaningful corresponding body parts. If the participant marked a body part several times for the same tic, it was counted only once. The following complex motor tics were not included in the analyses: copropraxia, echopraxia, spinning around, and autoaggressive actions (self-injuries) because no clear assignment to one body part was possible. *density (%) of motor tics is based on the absolute number of 32 different motor tics reported by all participants (n = 291) in the particular body part divided by the total number of motor tics reported by all participants; †density (%) of PU is based on the absolute number of marks per body part for motor tics divided by the number of marks for all body parts for motor tics.
Regarding vocal tics, the most frequently reported PU locations were at the mouth, throat, and chest, followed by (in descending order) the forehead and nose. Together, these five locations accounted for 69.8% of the PU densities reported for vocal tics. Only rarely were PUs preceding vocal tics reported to be located at the arms/hands and legs/feet (all together 0.6%) (Figure 3).
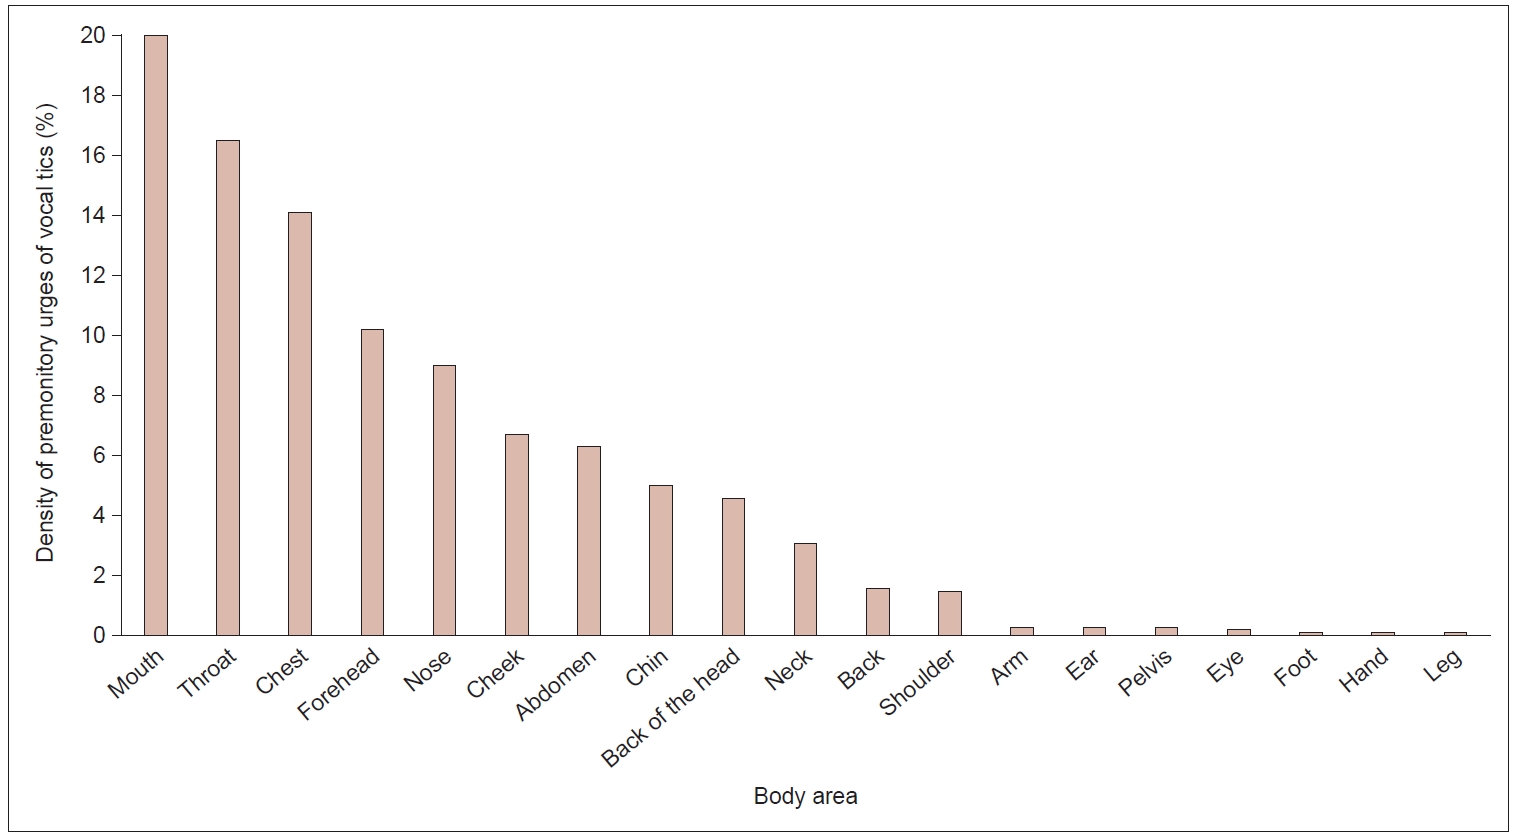
Density of premonitory urge (PU) of all 20 vocal tics investigated. Density (%) of PU is based on the number of marks per body area for vocal tics divided by the number of marks for all body areas for vocal tics. If the participant marked a body area several times for the same tic, it was counted only once.
When clustering motor versus vocal tics and simple versus complex tics, we found that compared with simple tics, complex (motor and vocal) tics were more often preceded by a PU. However, no difference in PU frequency was observed between motor tics and vocal tics (Figure 4).
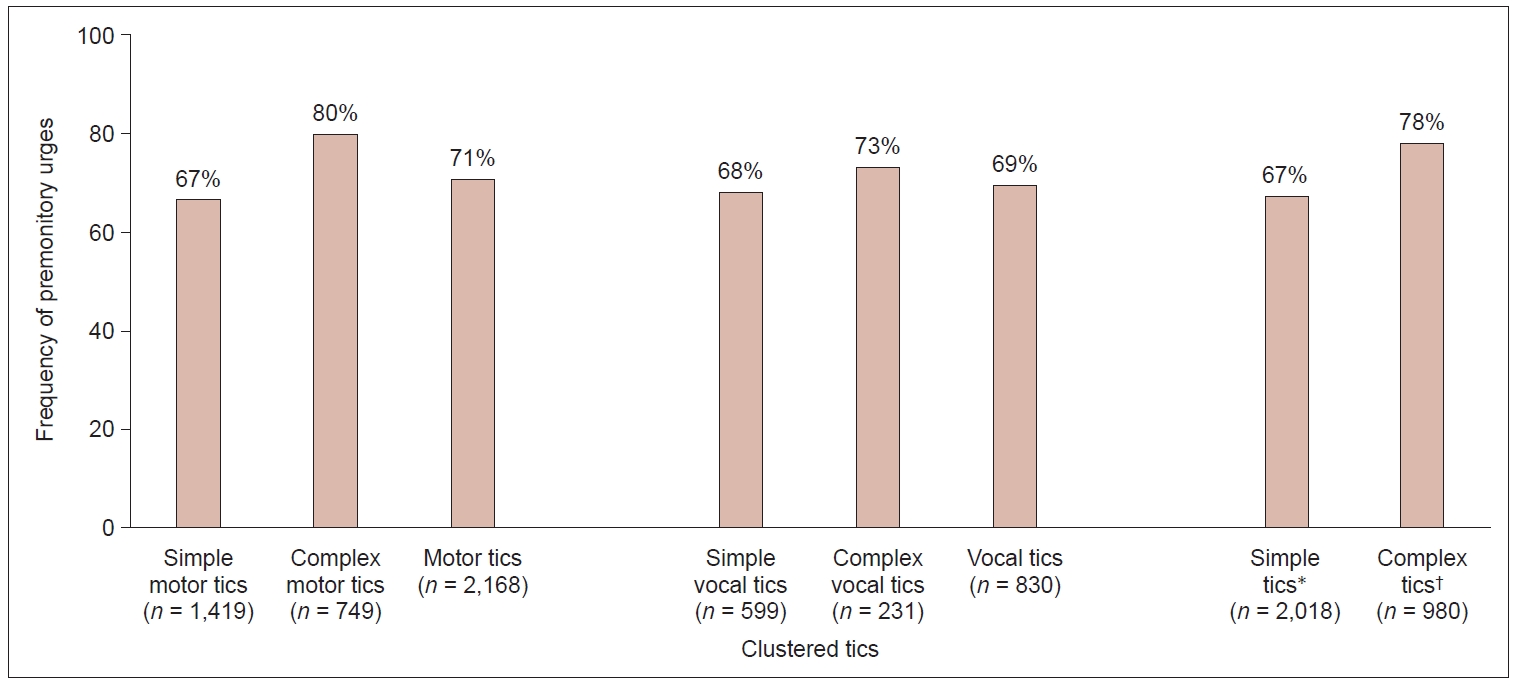
Frequency of premonitory urges (PUs) of tics clustered for motor, vocal, simple, and complex tics. Frequency of PUs is calculated as follows: participants reporting a PU (“always” or “sometimes”) divided by the total number of participants reporting the particular tic. Absolute numbers of tics are given in brackets. *simple tics, including simple motor and vocal tics; †complex tics, including simple motor and vocal tics.
2) Analogous to the procedure suggested by Leckman et al. [10], we selected for further analyses the five motor tics and three vocal tics that were reported as “most common” in our sample (be aware that these tics differed from those “most common tics” found in Leckman et al.’s [10] study; corresponding data are given below). This included only simple motor tics (located at the face, head, arms and hands) and simple vocal tics (Table 2). For these “most common” motor tics, PU density was highest either exactly at the location or in direct proximity to the corresponding tic. The highest PU densities for the most common vocal tics were (in descending order) at the throat, nose, mouth, and chest.
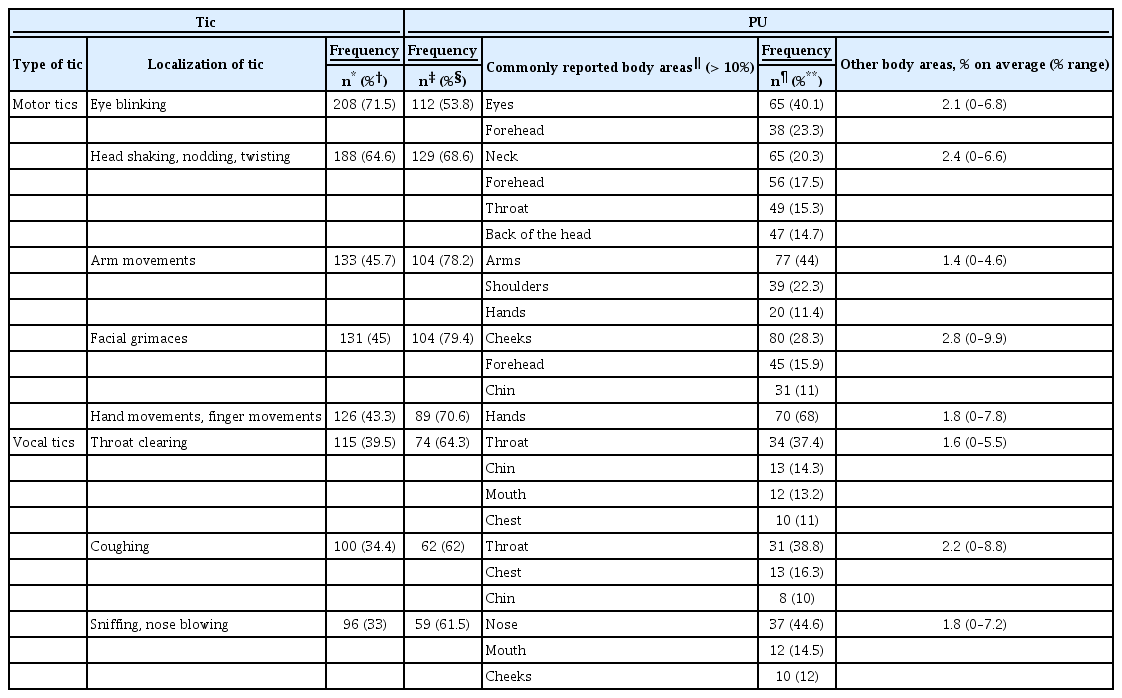
Frequency and location of premonitory urges (PUs) for the five most common motor tics and the three most common vocal tics as reported in our sample
3) To allow a direct comparison to Leckman et al.’s [10] data, we clustered the tics indicated in our study (n = 36 motor and n = 20 vocal tics) to the eight “common motor and phonic tics” selected by Leckman et al. [10] (Supplementary Figure 1 in the online-only Data Supplement). As shown in Figure 5, the distribution of PUs in the two studies largely differed. Our results are still nearly identical to our findings based on a more detailed assessment of tics, as described above and as illustrated in Figure 1. In Supplementary Table 3 in the online-only Data Supplement, a comparison between the approaches of both studies is provided.
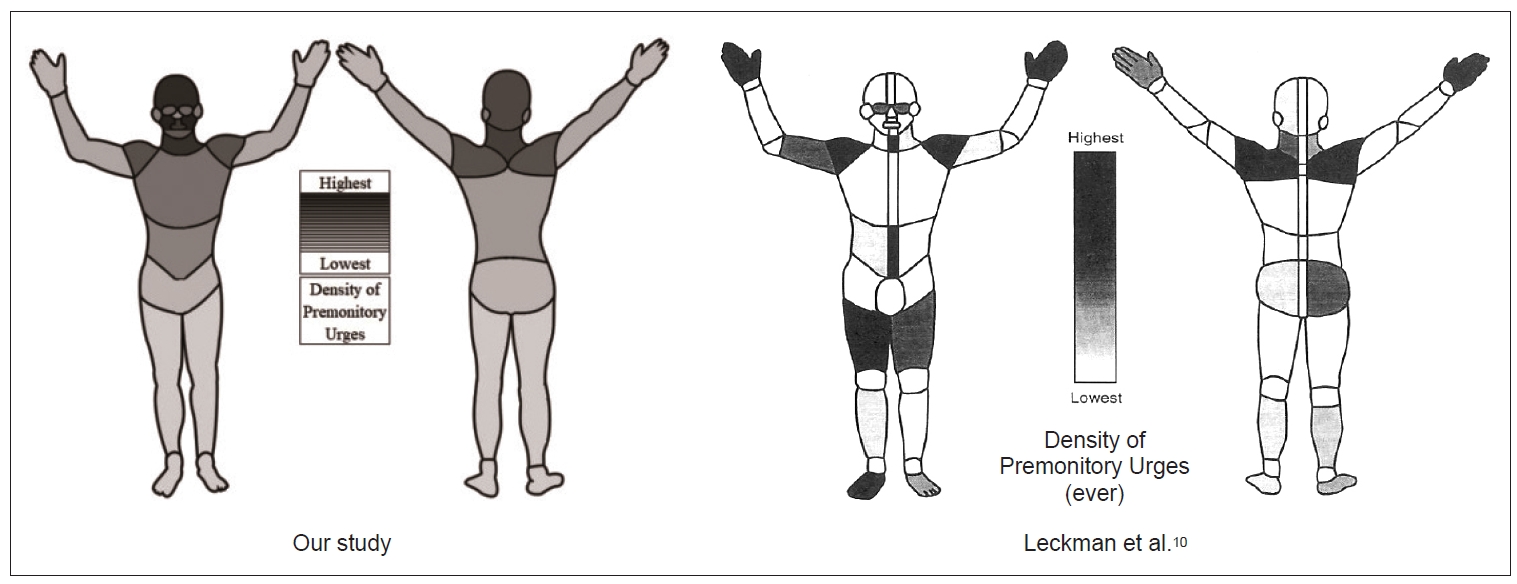
Density of premonitory urges (PU) of “eight common motor and phonic tics,” as selected by Leckman et al., [10] from our study (n = 232 participants) compared to Leckman et al.’s [10] original figure (n = 101 participants). The left figure is based on 19 body areas (for definition see text) corresponding to the full body scheme used by Leckman et al. [10] If the participant marked a body area several times for the same tic, it was counted only once. Densities (%) of each body area are based on the number of marks per body area of the eight tics for all participants divided by the number of marks of all body areas of the eight tics for all participants. The density ranges from a maximum of 14% at the cheeks to a minimum of 0.2% at the legs and feet. In contrast to Figure 1, we decided for a black-and-white illustration to enable the best possible comparability with the original figure given by Leckman et al., [10] which can be seen on the right side.
Thus, regardless of the approach used, the most common anatomical PU location was reported at the same location as the tic or at a location in direct proximity (Supplementary Table 4 in the online-only Data Supplement).
DISCUSSION
This is the first study examining PU location at a detailed level since the publication of Leckman et al. [10] in 1993. In line with our hypothesis—and in contrast to Leckman et al.’s [10] results—we found that PUs and their corresponding tics are located in the same body areas. In addition, we demonstrated that the most frequent PU locations are the face and head. Thus, PUs are most frequently experienced in those body areas where tics most frequently occur.
PU location compared to Leckman et al.’s [10] findings
Leckman et al. [10] found that PUs were most commonly located at the hands, shoulders, midline abdomen, and throat, followed by the thighs, feet, arms, and eyes; in contrast, we found a different PU distribution, with the highest frequencies at the forehead, cheeks, mouth and throat. Notably, our findings were independent of the approach used (inclusion of all tics or only those five most common motor tics and three most common vocal tics in our and in Leckman et al.’s [10] study, respectively). We believe that the differences between the two studies can best be explained by the differences in sample sizes and patient age, as well as by the limitations in Leckman et al.’s [10] study due to the paper-and-pencil-based format used and the limited opportunity each participant had to precisely indicate PU locations for a larger number of corresponding tics [10].
Location of PUs
Patients reported experiencing PUs, particularly at the forehead, cheeks, and mouth. The chest and abdomen showed higher PU densities than the extremities, with slightly higher densities at arms/hands than at legs/feet. These results are largely consistent with previous findings reporting a PU location, especially at the head/face, neck/throat, arms, and shoulders [5-7,13]. Compared to the arms and shoulders, the chest was a relatively common PU location in our study. This can be explained by the fact that our analyses of general PU locations also included vocal tics, in which the chest was the third most commonly reported PU location. Thus, the PU distribution overlaps with the well-known distribution of motor tics, which are most often located in the face and at the head [25,26]. The only exception was for eye tics, which might be explained by their very short duration and the fact that, in most cases, they cause no impairment and therefore are often not even experienced by patients.
Interestingly, participants more frequently reported PUs in the torso and shoulder region than motor tics in these body parts. It is possible that in these relatively large body parts, PUs may be experienced not only for motor tics exactly located in these body parts but also for tics located in adjacent body parts.
For all body parts, PUs were more frequently reported at the front than at the back of the body. When we compared PU densities reported by participants fulfilling the diagnostic criteria of TS (according to the ICD-10) to PU densities reported by the whole sample group, we did not find any relevant differences. This result further corroborates the hypothesis that TS and other PTDs belong to one spectrum of tic disorders [27].
PU location compared to tic location
To date, the location of tics compared to the location of PUs has been examined in only one small study (n = 15) [5]. In line with our results, tics were reported to occur more frequently in body regions where patients experienced PUs. However, the authors did not examine PU locations specifically in relation to their corresponding tics [5]. Our study fills this gap by investigating whether PUs are experienced at the same location or at a different location from the corresponding tic. We can clearly show that the majority of PUs are indeed experienced exactly in those body regions where the corresponding tics occur. Our results therefore further support the hypotheses not only that PUs represent the “core” of PTD [28] but also that PUs are inextricably linked to the occurrence of a specific “matching” tic [14]. Unlike in the generation of tics, in the generation of PUs, the cingulate cortex seems to play the most important role [29]. Assuming that PUs are a prerequisite for the generation of tics, future treatment strategies should focus on the improvement of PUs instead of the reduction of tics, which might result in better tic control. To date, there has been no known treatment that unequivocally improves both tics and PUs. Finally, deeper knowledge about typical localization and further characterization of PUs may help to differentiate tics from other hyperkinetic movements, including functional tic-like behaviors [30].
Notably, more than half the participants reported a PU for at least one of their tics that was either at a certain place on the body that did not match the location of the tic, or that they were unable to localize to a corresponding place on the body. The experience of such diffuse or generalized PUs has been described before [2,31]. Interestingly, in line with a single case report [32], a very small number of patients reported experiencing PUs outside of the body. However, we found no relevant differences between this small group of patients and the whole sample group.
To the best of our knowledge, the PU location of vocal tics has been investigated only once [7]. Overall, in line with our data, the authors found that the “neck/throat” (22%) was the most common PU location, followed by the “whole body/other region” (6%) [7]. Based on our results, the mouth, throat, and chest are the most commonly reported PU locations for 50.6% of vocal tics. In 25.9% of vocal tics, PUs were experienced in other parts of the face (forehead, nose, and cheek), and in 6.3% of vocal tics, PUs were reported at the abdomen. Thus, in nearly 83% of vocal tics, preceding PUs were experienced in a body region associated with phonation, whereas only 17% were experienced in other body regions. Thus, it can be concluded that PUs preceding vocal tics correspond to muscle groups involved in the anatomic origin of vocal tics.
PU frequency
When asked in general, 75.9% of the participants reported the experience of PUs. This is in line with previous findings reporting PU frequencies of 75.6% and 79%, respectively [7,9], although in other studies, higher (92% to 100%) [3,5,6,10,33] or lower PU frequencies (67.8%) [2] were found, with the lowest frequency reported in a study on children only (37%) [8]. When asked about PU experiences for each individual tic, the participants reported a PU frequency that was slightly higher (79.7%) than when asked about PUs in general, suggesting that awareness of PUs increases with an increase in tic awareness. This is supported by studies on Habit Reversal Training for tics, which demonstrate that PU awareness training results in an increased experience of PUs [34]. However, it cannot entirely be excluded that being asked specific questions prompted patients to report more PUs.
While we found no difference in PU frequency preceding motor tics versus vocal tics (71% vs. 69%), in line with previous findings, PU frequency was higher before complex tics than before simple tics (78% vs. 67%) [35,36]. This difference was particularly evident for motor tics (complex motor tics: 80% vs. simple motor tics: 67%). One might speculate that patients are often not fully aware of simple motor tics because of their short duration and the involvement of only a few muscles [37,38], which might also result in a lower awareness of PUs. This would also explain why the lowest PU frequency (in our study as well as in Leckman et al.’s [10] study) was reported before tics involving the eyes, such as blinking or eye rolling. Alternatively, it can be hypothesized that the underlying pathophysiology of simple motor tics differs from that of complex motor tics [36].
Interestingly, we found a higher reported PU frequency in females (98.6% vs. 73.8%), while Leckman et al. [10] found a higher reported PU frequency in males (97% vs. 83%). Because of our relatively large sample size, which included 70 females, we believe that our results can be regarded as robust. One might speculate that this difference in reported PU frequency between males and females depends on interoceptive awareness. On the one hand, it has been shown that (healthy) females have better interoceptive awareness than males [39]; on the other hand, in patients with PTD, greater interoceptive awareness has been shown to result in greater awareness of PUs [40].
PU lateralization
In line with Leckman et al.’s [10] data, we found that the majority of the patients experienced a symmetrical distribution of both tics (74.9%) and PUs (77.4%) on both sides of the body. Only a minority of the patients indicated that either tics and/or PUs were more frequently located on one side of the body than the other, with no relevant differences noted between the left and right sides. Thus, from our data, it is suggested that handedness has no relevant influence on tic and PU locations, although we did not measure handedness.
Momentary relief of PUs
Finally, 97% of the participants reported feeling, for at least one of their tics, a relief of the PU after performing the tic. By contrast, in earlier research [6,10,33], only “overall” relief rates have been reported, which therefore cannot be directly compared to our data, but which showed somewhat lower values, between 83% and 85% [6,10,33].
Limitations
The following limitations have to be addressed: 1) Due to the study design, only self-assessments could be used. 2) Diagnoses and age data were based on patients’ self-report, with no possibility of external verification; thus, participation of people not fulfilling inclusion criteria cannot be entirely ruled out. However, we are convinced that the information was reliable because most patients were recruited via TS outpatient clinics and advocacy groups. In addition, we excluded those patients from further analyses who stated that their diagnosis had not been confirmed by a psychologist or physician. 3) Multiple participation in the study cannot be entirely ruled out, especially because subjects received compensation worth €25. However, we consider this number to be very low and negligible. 4) Since we evaluated specific PU location per tic and not per participant, the number of tics indicated by a participant may have influenced our results.
In summary, on the basis of our data, PU location in patients with PTD has to be reconsidered. We were able to demonstrate that the PU location corresponds to the tic location, with the highest PU frequency in the face and at the head. Thus, PUs show comparable tics—and in contrast to previous belief—a clear rostro-caudal distribution. Compared with simple motor tics, complex motor tics are more often preceded by a PU, while PU frequency does not differ between motor and vocal tics. PUs are more frequently experienced at the front than at the back of the body, with no difference between the left and right sides.
Supplementary Materials
The online-only Data Supplement is available with this article at https://doi.org/10.14802/jmd.21045.
Supplementary Table 1.
Density of premonitory urges (PUs)
Supplementary Table 2.
Density of premonitory urges (PUs) in all 95 body regions investigated
Supplementary Table 3.
Comparison between Leckman et al.’s [10] and the present study
Supplementary Table 4.
Clustered tics with frequency and location of premonitory urges (PUs)
Supplementary Figure 4.
Frequency of premonitory urges (PUs) of the eight common motor and phonic tics which were selected and reported by Leckman et al. [10] *frequency of the PU is calculated as follows: participants reporting a PU (“always” or “sometimes”) divided by the total number of participants reporting the tics; †the tics “facial grimacing” and “complex facial movements or expressions” were summarized as “facial grimaces”. ‡the tics “shoulder shrugging” and “shoulder gestures” were summarized as “shoulder jerks”. §the tics “head shaking/twisting/shrugging/nodding” and “head gestures” were summarized as “head/neck movements”; ∥the tics “mouth movement”, “complex mouth movement” and “lip movement” were summarized as “mouth movement”; ¶the tics “coprolalia”, “palilalia”, “non-obscene socially inappropriate behavior”, and “echolalia” were summarized as “words or phrases”.
Notes
Conflicts of Interest
The authors have no financial conflicts of interest.
Funding Statement
This work was partly supported by the Else Kröner-Fresenius-Stiftung within the KlinStrucMed programme 2017–2018 of the Hannover Biomedical Research School without being involved in the study design, the collection/analysis/interpretation of the data, the writing of the report, or the publication process.
Author Contributions
Conceptualization: Kirsten R Müller-Vahl, Ewgeni Jakubovski, Jana Essing, Nikolas Psathakis, James F Leckman. Data curation: Jana Essing, Sinan N Cevirme, Nikolas Psathakis. Formal analysis: Jana Essing, Sinan N Cevirme, Nikolas Psathakis. Funding acquisition: Jana Essing. Methodology: Jana Essing, Sinan N Cevirme, Nikolas Psathakis, Ewgeni Jakubovski. Supervision: Kirsten R Müller-Vahl, Ewgeni Jakubovski, James F Leckman. Writing—original draft: Jana Essing. Writing—review & editing: Kirsten R Müller-Vahl, Ewgeni Jakubovski, Sinan N Cevirme, Nikolas Psathakis, James F Leckman.
Acknowledgements
We thank all patients for participation in this study. The support for statistical analyses by Theodor Framke, Institute of Biostatistics, Hannover Medical School (MHH), and the suggestions by Valerie Brandt, Department of Psychology, Centre for Innovation in Mental Health, University of Southampton, UK, are kindly acknowledged.
We thank the Else Kröner-Fresenius foundation for supporting this project. The funders were not involved in the data collection, analysis, or manuscript writing.